Audio Myth - "Damping Factor Isn't Much of a Factor"

Myth - "Damping Factor Isn't Much of a Factor"
Myth - "A Damping Factor of 10 is High Enough"
Myth - "All Amplifiers Have a High-Enough Damping Factor"
Where did these Myths Originate?
These myths seem to trace back to a well-known paper (PDF) written by Dick Pierce. His analysis shows that a damping factor of 10 is virtually indistinguishable from a damping factor of 10,000 when it comes to damping the motion of a loudspeaker cone. This analysis has been examined and repeated in many more recent articles, such as a well-written post on Audiofrog.com by Andy Wehmeyer. Articles such as these are often cited as evidence that amplifier damping factor doesn't matter. The mathematical analyses are correct, but the conclusions are incomplete and misleading! The papers were written to bust one damping factor myth but ironically they spawned another.
Damping is Not an Issue, but there IS an Issue!
These papers show that the damping of driver motion cannot be significantly improved by raising the damping factor above 10. They also point out that most amplifiers easily exceed this requirement. On the surface, both papers seem to imply that damping specifications are not important. If you are one of the many people that jumped to that conclusion, you are perpetuating a myth. It is time to go back and ...
... read the papers more closely!
If you take a close look at each of these two papers you will see some obscure comments that most readers seem to miss:
Dick Pierce wrote:
"There may be audible differences that are caused by non-zero source resistance. However, this analysis and any mode of measurement and listening demonstrates conclusively that it is not due to the changes in damping ..."
Likewise, Andy Wehmeyer wrote:
"There is a real benefit in low output impedance. We’ll save that one for another tech tip."
In other words, both papers acknowledge that there may be some audible benefits to having a high damping factor! Unfortunately they fail to identify these benefits.
These papers also fail to mention that "damping factor" was a poor choice of terminology. "Damping factor" is sort of an upside-down way of specifying the output impedance of a power amplifier.
I will attempt to pick up where these papers left off and bust the myth that they inadvertently created. With some simple math, I will quantify the benefits of having a low output impedance (or high damping factor).
The Frequency Response Problem
The frequency response of a power amplifier is normally measured using an ideal resistive load. An amplifier with a flat frequency response specification may have an entirely different frequency response when it is loaded by the impedance of a speaker. Speakers have resistive, inductive, and capacitive characteristics that change with frequency. If the amplifier damping factor is too low, these variations will have an audible impact on the system response.
Speaker Impedance and Phase Plots

Figure 1
The plot above shows the impedance and phase angle of a set of three-way speakers that we have in our listening room. We keep these on-hand because they are an example of a difficult-to-drive "8-Ohm" speaker. The solid curve is the impedance, measured in Ohms (left axis) and the dotted curve is the phase angle of the load, measured in degrees (right axis). The horizontal axis is frequency and it has a range of 10 Hz to 50 kHz.
Notice that the impedance at 119 Hz is only 2.6 Ohms. Also notice that the phase angle at 94 Hz is -53 degrees, indicating a highly capacitive load. I'll spare you the math, but the combination of these two parameters means that at 100 Hz, the amplifier will need to deliver the same current that would be required by a 2.2 Ohm resistive load.
Also notice the rapid changes in impedance vs. frequency. The impedance is 19 Ohms near 30 Hz, but just 6 Ohms near the 45 Hz lower limit of the speaker's response. At 65 Hz, the impedance is almost 13 Ohms. These rapid impedance changes are typical near the lower limit of a speaker system.
This speaker has crossover frequencies at 300 Hz and at 3 kHz. Notice that the 300 Hz crossover creates a bump in the impedance curve. Also notice that the impedance swings from 18 Ohms to 8 Ohms as we transition through the 3 kHz crossover frequency.
The point of all of this is that speakers are not resistive loads. Speaker impedances change significantly, and often rapidly, across the audio band. These impedance variations can cause significant changes in the frequency response at the amplifier output if the amplifier's output impedance is too high.
What does this have to do with damping factor? The "damping factor" is just a way of specifying the output impedance of the amplifier:
"Damping Factor" is an Impedance-Ratio Specification
By definition, the "damping factor" is the ratio of a speaker's nominal input impedance to the amplifier output impedance:
Damping Factor = Speaker Impedance / Amplifier Impedance
On most amplifier specification sheets, the damping factor specifications assume an 8-ohm speaker impedance. When this is the case, the following equations can be used to determine the amplifier output impedance:
Damping Factor = 8 / Amplifier Impedance
or
Amplifier Impedance = 8 / Damping Factor
Notice that the Damping Factor is high when the Amplifier Impedance is low.
The Impedance Ratio (Damping Factor) Determines the Accuracy of the System Frequency Response
The output impedance of the amplifier forms a voltage divider with the speaker load impedance. If the amplifier output impedance is very low (high damping factor), the resistive, inductive and capacitive portions of the speaker impedance will have little impact on the amplitude or phase response at the output of the amplifier.
In contrast, if the amplifier output impedance begins to approach that of the speakers (damping factor of 1), the resistive, inductive and capacitive portions of the speaker impedance will have a major impact on the amplitude and phase response at the output of the amplifier.
Damping Factor vs. Output Impedance
Please understand that "damping factor" and "output impedance" specifications describe the same amplifier characteristic but they do so in an inverse fashion. An amplifier with a high damping factor will have a low output impedance.
With 8-Ohm speakers, a damping factor of 10 is achieved when the amplifier output impedance is 0.8 Ohms. A damping factor of 100 is achieved when the amplifier output impedance is 0.08 Ohms. A damping factor of 1000 is achieved when the amplifier output impedance is 0.008 Ohms. The lower the output impedance, the higher the damping factor, but let's not get carried away...
Speaker Cables Set a Practical Limit on the Damping Factor
A typical set of 10-foot 12-AWG speaker cables will have a round-trip series resistance of 0.0318 Ohms. If these were driven by a zero-ohm amplifier (if such an amplifier existed), the damping factor would be 200. Benchmark offers 11-AWG cables that have a round-trip series resistance of 0.0252 Ohms. These would limit the damping factor to 317 if driven from a zero-ohm amplifier.
In other words, damping factors greater than 200-300 can rarely be achieved at the speaker terminals. If damping factors near 1000 were important, we would need to place the amplifier very close to the drivers and/or use some very large conductors. However, don't go out and buy welding cables; large conductors have inductance problems. Skip the welding cables, as this paper will show that we don't need a damping factor of 1000.
Damping Factor: 10 is too Low and 1000 is Unnecessary
The frequency response of a given speaker is only repeatable, from amplifier to amplifier, when all of the amplifiers have a reasonably high damping factor. If you connect the speaker to an amplifier with a low damping factor, the speaker loading will change the frequency response at the amplifier terminals and at the acoustic output of the speaker. This change in response is especially problematic at the low end of the speaker's range and at each of the crossover frequencies.
Here is a Simple Circuit Diagram:
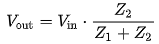
The amplifier output impedance and the speaker input impedance form a voltage divider (see Figure 2). Z1 is the amplifier impedance and Z2 is the speaker impedance. The input voltage is divided or split between Z1 and Z2. Vin is the voltage that the amplifier would produce without a load. Vout is the voltage at the terminals on the back of the power amplifier when the speaker (Z2) is connected.

or

Figure 2
The second equation in Figure 2 is the "transfer function". It tells us how much of the input signal reaches the output.
The amplifier output impedance, Z1, is typically resistive. This means the amplifier output impedance does not change with frequency. This also means that we can refer to the amplifier output impedance as an "output resistance".
In contrast, the speaker input impedance, Z2, has significant inductive and capacitive components. This means that the speaker impedance changes with frequency (as we can clearly see from solid curve in Figure 1).
To keep the math simple, we will ignore the phase shifts that are produced by the inductive and capacitive characteristics of the speakers. In other words, we will ignore the phase angles shown by the dotted curve in Figure 1. This simplified analysis will give us the amplitude response of the amplifier-speaker interface.
The simplified voltage divider looks like this:

The transfer function is:

Figure 3
R1 is the amplifier output impedance. R2 is the speaker input impedance at a specific frequency. In our example, R2 can be read directly from the impedance curve shown in Figure 1.
Example 1 - Damping Factor of 10
At a damping factor of 10, the amplifier output impedance (R1) is:
- R1 = 8/10 = 0.8 Ohms
From Figure 1 we can see that our speakers have a minimum impedance of 2.6 Ohms at 119 Hz.
- R2 = 2.6 Ohms.
Using the "transfer function" equation in Figure 3 :
- The signal reduction at the 2.6-Ohm impedance point will be 2.6/(2.6+0.8) = 0.714.
- Converting to dB: 20*Log(0.714)= - 2.3 dB
This means that the amplifier output will decrease by 2.3 dB at 119 Hz when loaded by the speaker impedance.
But, near 3 kHz, our speaker input impedance is 18 Ohms.
- The signal reduction at the 18-Ohm point will be 18/(18+0.8) = 0.957.
- Converting to dB: 20*Log(0.957) = -0.3 dB
At a damping factor of 10, 119 Hz was attenuated by 2.3 dB while 3 kHz was attenuated by just 0.3 dB. The difference is 2.3 dB - 0.3 dB = 2 dB.
This means that there will be a 2 dB change in the overall shape of the frequency response curve when this set of speakers is driven from an amplifier with a damping factor of 10. The 2.3 dB loss of bass near 119 Hz is significant and should be noticeable under certain circumstances.
Myth Busted! A Damping Factor of 10 is Too Low!
Example 1 shows that a damping factor of 10 can have an audible effect on the frequency response of the amplifier-speaker system! A damping factor of 10 is too low! Let's investigate higher damping factors ...
Example 2 - Damping Factor of 100
At a damping factor of 100, the output impedance of the amplifier (R1) is:
- R1 = 8/100 = 0.08 Ohms.
At 119 Hz, the speaker input impedance (R2) is:
- R2 = 2.6 Ohms
The transfer function at 119 Hz is:
- 2.6/(2.6+0.08) = 0.970
Converting to dB, the attenuation at 119 Hz is:
- 20*Log(0.970)= -0.26 dB
At 3 kHz where R2 = 18 Ohms, the transfer function is:
- 18/(18+0.08) = 0.996
- Converting to dB: 20*Log(0.996)= -0.04 dB
The difference between the two points is now 0.26 dB - 0.04 dB which is 0.22 dB.
In Example 2, the damping factor of 100 keeps the frequency response variations less than about 0.2 dB. In a static situation, the listener would quickly adapt to this 0.2 dB change in speaker response and it is unlikely that the listener would detect a change in speaker voicing. For this reason, we could argue that frequency variation 0.2 dB is good enough.
Nevertheless, it is possible that this 0.2 dB variation could be detected in a A/B or A/B/X test between two amplifiers having different damping factors (one with a damping factor of 100 and one with a much higher damping factor). If we match the amplitudes at 3 kHz, one amplifier could be almost 0.2 dB louder at 119 Hz using our example speakers.
The general rule of thumb for A/B and A/B/X tests is that levels should be matched to better than 0.1 dB. If this is not done, the level changes can be detected by many listeners. In other words, a damping factor of 100 may have some perceptible impact on the sound in a controlled test, even if it may go unnoticed in general listening.
Example 3 - Damping factor of 200
At a damping factor of 200, the output impedance of the amplifier (R1) is:
- R1 = 8/200 = 0.04 Ohms.
At 119 Hz, the speaker input impedance (R2) is:
- R2 = 2.6 Ohms
The transfer function at 119 Hz is:
- 2.6/(2.6+0.04) = 0.9848
Converting to dB, the attenuation at 119 Hz is:
- 20*Log(0.9848)= -0.133 dB
At 3 kHz where R2 = 18 Ohms, the transfer function is:
- 18/(18+0.04) = 0.998
- Converting to dB: 20*Log(0.998)= -0.019 dB
The difference between the two points is now 0.13 dB - 0.02 dB which is 0.11 dB.
So, at a damping factor of 200, the frequency response variations are held to about 0.1 dB which satisfies the level matching for A/B/X testing. This implies that the frequency response matching is good enough that it could not be detected in a well-controlled A/B/X test.
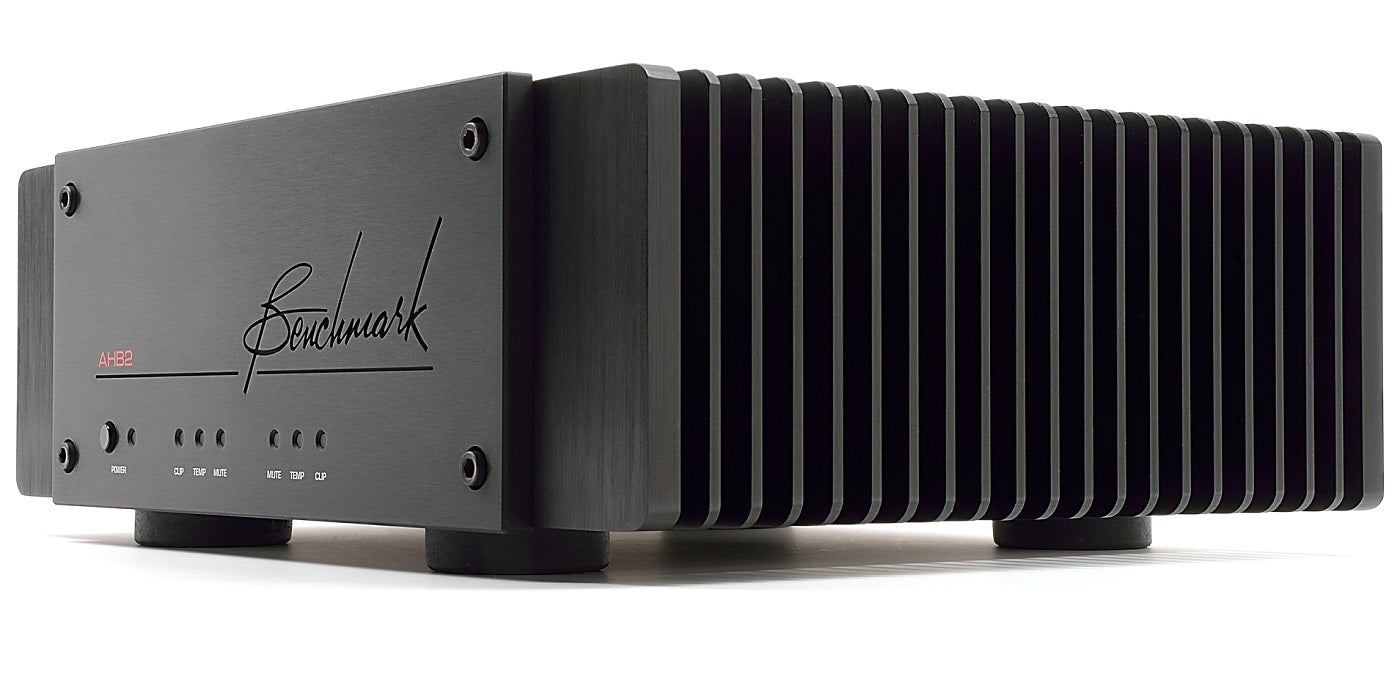
Benchmark's Approach to Damping Factor
It is no accident that the Benchmark AHB2 has a damping factor of 370. It was our goal to keep impedance-related frequency response variations less than 0.1 dB when driving 8-Ohm speakers. With our difficult-to-drive example speakers, the net frequency response variation is just 0.061 dB, easily satisfying our 0.1 dB criteria for inaudibility. However, this ignores the resistance of the speaker cables. No practical system can exist without speaker cables, especially when a pair of speakers is fed from a single stereo amplifier. Let's assume 10-foot cables.
Benchmark sells 10-foot 11-AWG cables that have a round-trip series resistance of 0.0252 Ohms. When these cables are paired with the AHB2 amplifier, the effective damping factor can be calculated as follows:
- Amplifier output resistance = 8/370 = 0.0216 Ohms
- Speaker cable resistance = 0.0252 Ohms
- Total source resistance = 0.0216 + 0.0252 = 0.0468
- Effective damping factor = 8/0.0468 = 171
At a system damping factor of 171, the frequency response variations would be about 0.13 dB. This still very close to our 0.1 dB criteria for inaudibility. Notice that the amplifier damping factor needed to be significantly higher than 200 in order to achieve a system-level damping factor near 200. In this system, the speaker cables and amplifier have nearly equal contributions to the total source impedance. Lowering the amplifier's source impedance (raising the damping factor) below that of the cables will produce diminishing returns. If the amplifier had an infinite damping factor, the system frequency response at the end of the cables would only improve by 0.06 dB, which is insignificant. With an amplifier damping factor of 370, we have exceeded the threshold of diminishing returns.
Additional Considerations
The analysis above was focused on the amplitude response of the amplifier-speaker interface. I did this to keep the math as simple as possible. Nevertheless, I was able to show that a damping factor of 10 should have an audible effect on the amplitude response.
The amplifier output impedance will also produce phase shifts when loaded by inductance or capacitance. The dotted curve in Figure 1 shows positive and negative phase angles. These phase angles will be accentuated when the source impedance of the amplifier is factored into the response. It is somewhat more difficult to quantify the audibility of these phase changes, but they should only be an issue at very low damping factors.
Phase angles often change rapidly near driver crossover frequencies. In Figure 1, we can see that the phase angle changes from positive to negative as we sweep up through the 3 kHz crossover frequency. With some speakers it is possible that the source impedance of the amplifier could cause audible problems near the crossover frequencies when the damping factor is excessively low. At damping factors above 100 these effects should be minimal. At a damping factor of 10, the phase response variations may add additional audible differences.
Conclusions
Loudspeaker driver damping can be achieved with damping factors as low as 10. Raising the damping factor above 10, has almost no impact on driver damping. This has been shown by Dick Pierce and others.
A damping factor of 10 can produce amplitude response variations exceeding 2 dB. These variations should be sufficient to create audible changes in the apparent voicing of a loudspeaker.
A damping factor of 100 can produce amplitude response variations of about 0.2 dB. These may be just large enough to be detected in an A/B/X test where amplifiers are being compared, using a single speaker and a switch box. Nevertheless, the 0.2 dB variation may be small enough not to produce a noticeable change in the speaker voicing during normal listening. We can probably argue that a system-level damping factor of 100 is on the border line of audibility.
A damping factor of 200 can produce amplitude response variations that are only about 0.1 dB. These variations are so small that they should not be detectable, even in a well-controlled A/B/X test where we are comparing two amplifiers with high damping factors. Raising the system-level damping factor above 200 should produce no audible change.
10-foot 12-AWG cables will limit the system damping factor to something less than 200. Benchmark's 10-foot 11-AWG cables will limit the system damping factor to something less than 317.
Because of cable resistance, system-level damping factors exceeding 200 are often impractical. Frequency response variations are insignificant when system damping factors exceed 150.
I would recommend targeting a system-level damping factor above 150. This range is achievable and it will give excellent performance. To achieve this at the end of a set of speaker cables, the amplifier will need a damping factor of at least 300.
A system-level damping factor of 171 can be achieved at the end of a Benchmark 10-foot 11-Ga cable when driven by a Benchmark AHB2 amplifier which has a damping factor of 370.
Given 11 or 12 AWG cables, a system-level damping factor of 100 can be achieved with an amplifier damping factor of about 150. Likewise, a system-level damping factor of 150 can be achieved with an amplifier damping factor of about 300.
Amplifiers with a damping factor of less than 300 may have an audible impact on the frequency response of the playback system.
Damping Factor Calculator with Frequency Response
I have created a spreadsheet that you can use to calculate the frequency response variations that are caused by the amplifier output impedance and cable impedance. The image below shows the results for the example system described in this paper.

Open the spreadsheet and enter the parameters for your system in the orange cells as follows:
- Enter the nominal impedance of your speakers
- Enter the minimum impedance of your speakers
- Enter the maximum impedance of your speakers
- Enter the length of your speaker cables
- Enter the gauge of your speaker cables
The "Total Error" column will show the frequency response variations that are produced by the interactions between the source and load impedances. This column is color coded to indicate the expected audibility of the frequency response variations. Red indicates a high likelihood of audibility while green indicates a low likelihood of audibility.
Find the row that corresponds to your amplifier's 8-Ohm damping factor in the first column. Use your amplifier's 8-Ohm damping factor specification even if your speakers have a different nominal impedance. The spreadsheet makes the appropriate adjustments.
The "Effective Damping Factor" column shows the damping factor achieved at the speaker-end of the cable. It is also adjusted for the nominal impedance of the speakers. Notice that the speaker cables reduce the effective damping factor.
If you want to ignore the cable effects, set the cable length to 0.
The highlighted row (damping factor of 370) corresponds to the performance of the Benchmark AHB2.
The spreadsheet is completely unlocked and it does not contain any macros. Avoid making entries outside of the orange cells unless you wish to modify the spreadsheet or examine the formulas (which were explained in the examples). I hope you find this calculator helpful.
John Siau

Note: One reader provided a link to an article on damping factor that predates the Dick Pierce article by almost 27 years:
Augspurger, George L. (Jan 1967). "The Damping Factor Debate" (PDF). Electronics World. Ziff-Davis Publishing Company.
Revisions: 6/8/2020 - Corrected a numeric error in Example 2. Frequency response variation is 0.22 dB, not 0.5 dB, at a damping factor of 100 with the example speakers.
Also in Audio Application Notes
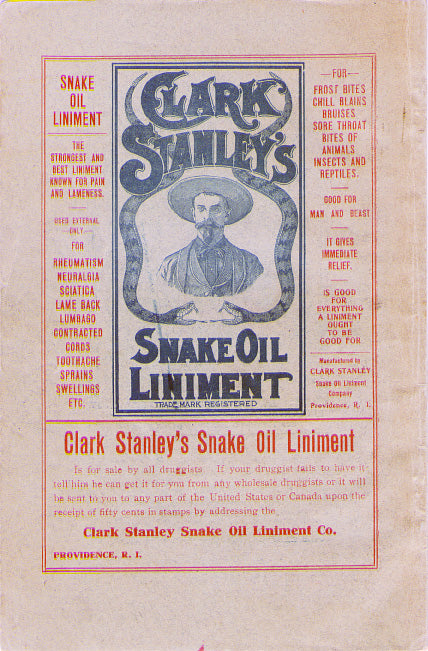

Audiophile Snake Oil
The Audiophile Wild West
Audiophiles live in the wild west. $495 will buy an "audiophile fuse" to replace the $1 generic fuse that came in your audio amplifier. $10,000 will buy a set of "audiophile speaker cables" to replace the $20 wires you purchased at the local hardware store. We are told that these $10,000 cables can be improved if we add a set of $300 "cable elevators" to dampen vibrations. You didn't even know that you needed elevators! And let's not forget to budget at least $200 for each of the "isolation platforms" we will need under our electronic components. Furthermore, it seems that any so-called "audiophile power cord" that costs less than $100, does not belong in a high-end system. And, if cost is no object, there are premium versions of each that can be purchased by the most discerning customers. A top-of-the line power cord could run $5000. One magazine claims that "the majority of listeners were able to hear the difference between a $5 power cable and a $5,000 power cord". Can you hear the difference? If not, are you really an audiophile?

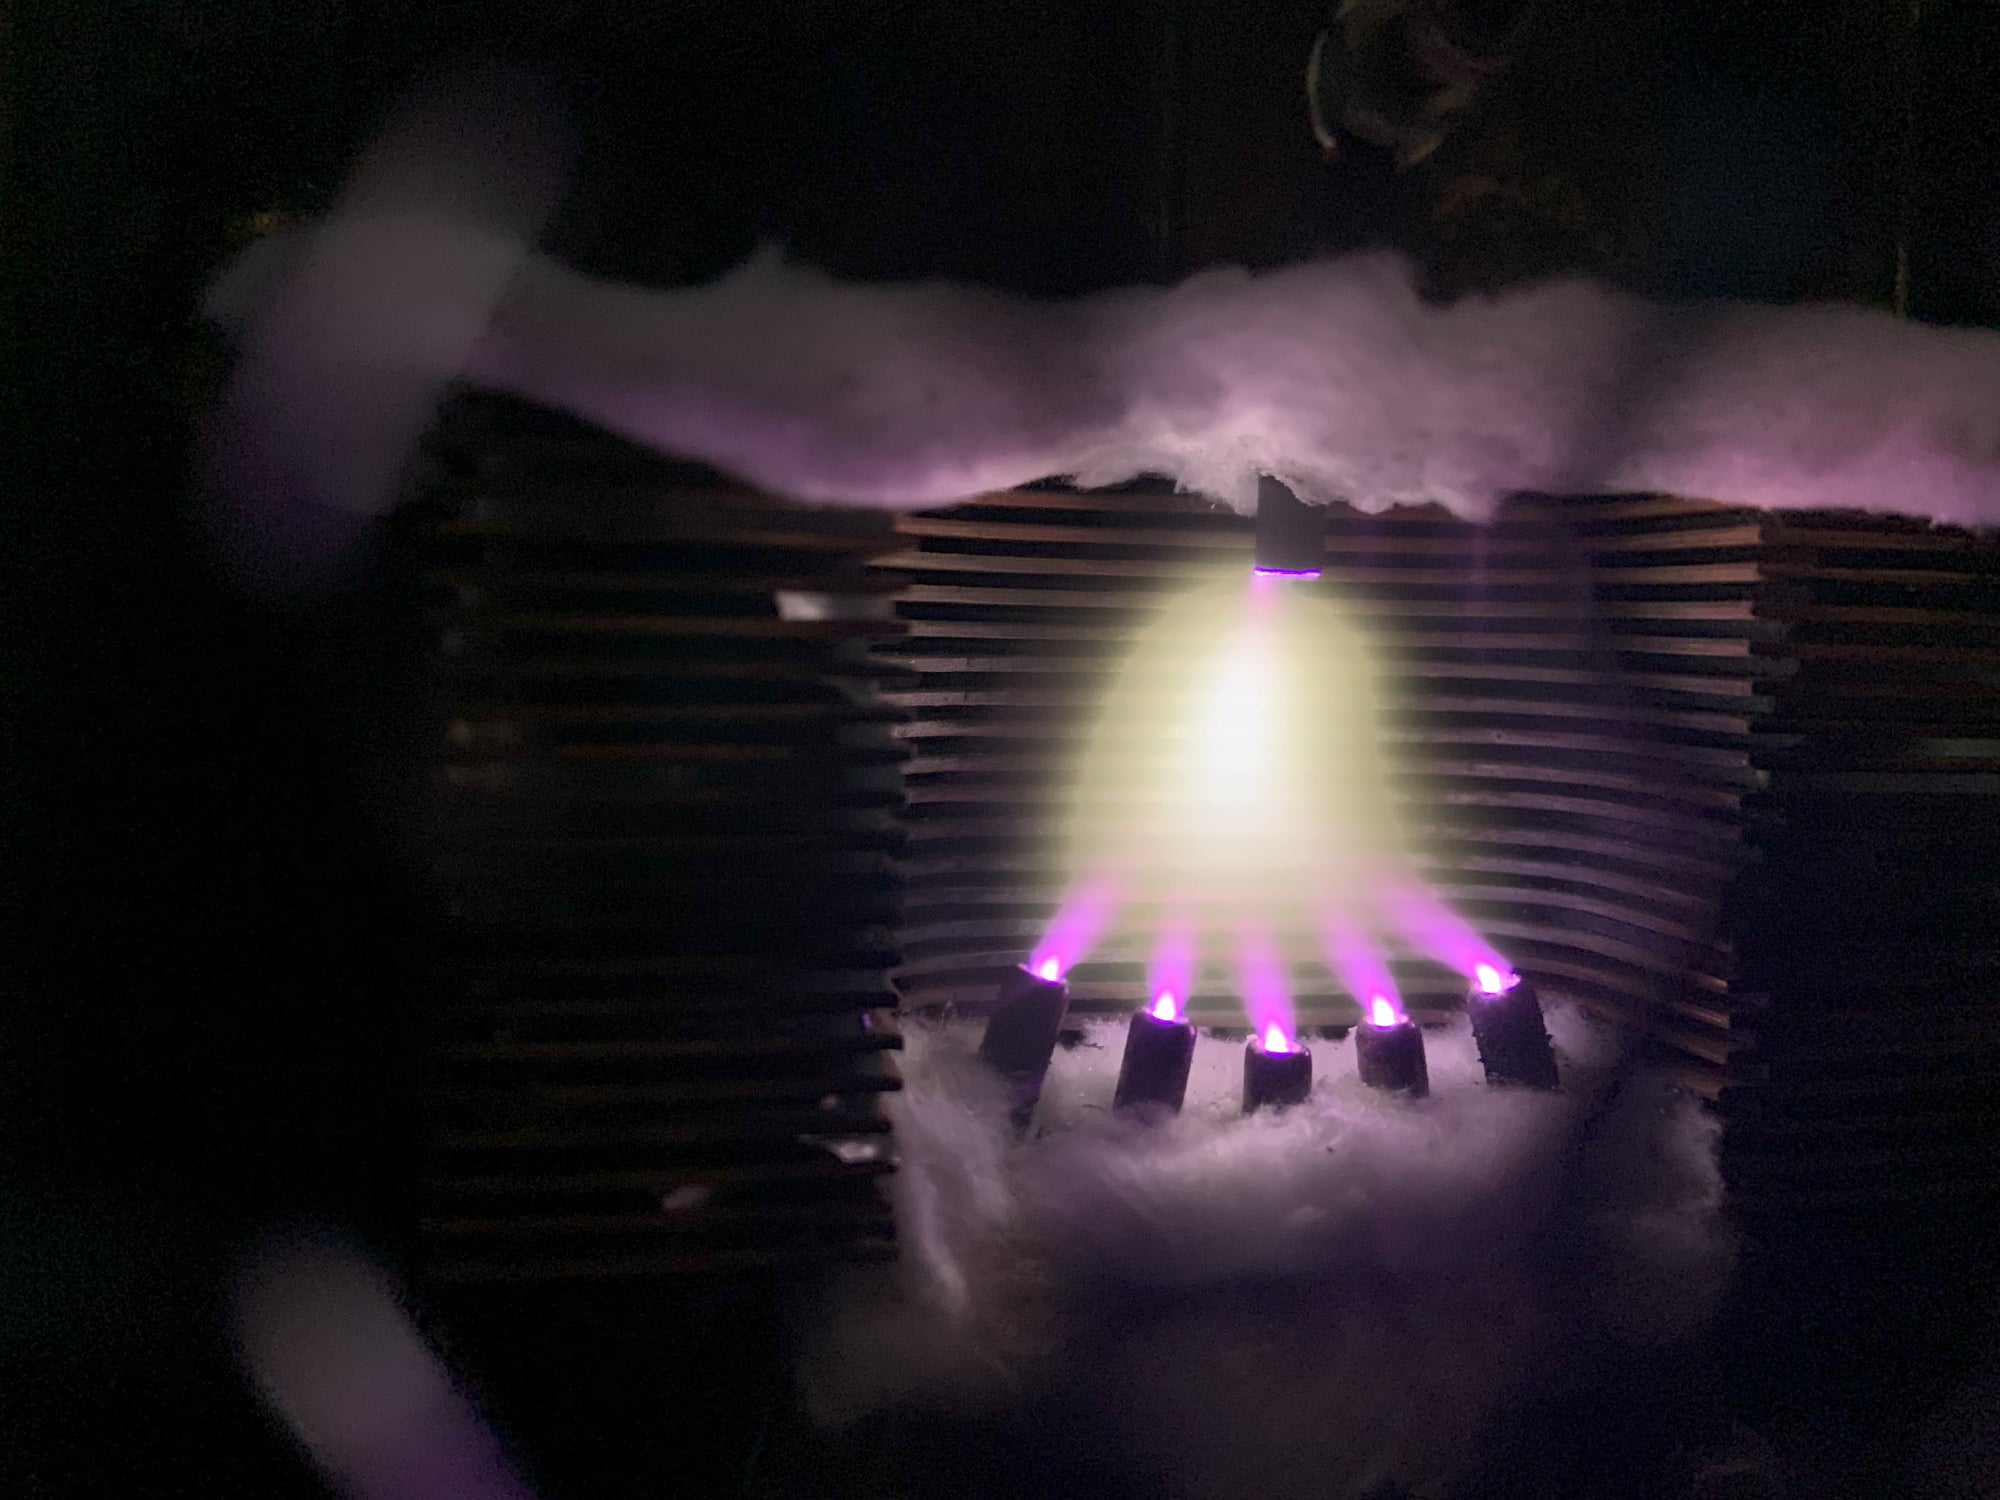
Making Sound with Plasma - Hill Plasmatronics Tweeter
At the 2023 AXPONA show in Chicago, I had the opportunity to see and hear the Hill Plasmatronics tweeter. I also had the great pleasure of meeting Dr. Alan Hill, the physicist who invented this unique device.
The plasma driver has no moving parts and no diaphragm. Sound is emitted directly from the thermal expansion and contraction of an electrically sustained plasma. The plasma is generated within a stream of helium gas. In the demonstration, there was a large helium tank on the floor with a sufficient supply for several hours of listening.

While a tank of helium, tubing, high voltage power supplies, and the smell of smoke may not be appropriate for every living room, this was absolutely the best thing I experienced at the show!
- John Siau

Audio Calculators
We have added an "Audio Calculators" section to our webpage. Click "Calculators" on the top menu to see more like these: