How Loud is the Distortion from Your Power Amplifier?

Would you put a Washing Machine in your Listening Room?
If the answer is no, you may be surprised to discover that the distortion produced by your power amplifier may be louder than the noise produced by a major appliance.
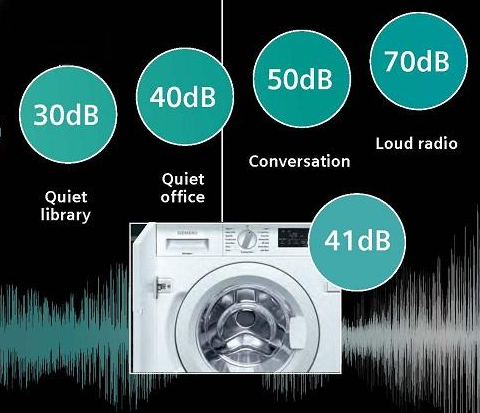
One appliance manufacturer created the following graphic:

This graphic shows a scale ranging from a sound pressure level (SPL) of 1 dB to 140 dB. It shows a quiet room at 30 dB, normal conversation at 50 dB, and some major appliances at about 40 dB.
We have probably all experienced someone talking in a movie theater, or talking while we are trying to listen to music. In a movie theater, the sound system and movie sound tracks are calibrated to reach peaks of about 105 dB SPL, but a 50 dB SPL conversation in the row behind is clearly audible and clearly distracting.
Noises at 40 dB SPL and lower, are often loud enough to be distracting when we are trying to listen to music. You would not put a major appliance in the middle of your listening room, but the distortion from your power amplifier may be louder than a washing machine!
"The Distortion from your Power Amplifier may be Louder than a Washing Machine!"
Don't believe me?
Let's look at some of the power amplifier test results published by Stereophile Magazine. For years, each review has included an extensive set of test plots from Stereophile's own test laboratory. This collection of test reports is a tremendous resource.
We will focus on Stereophile's "THD+N vs. Power" plots for 7 of their top-rated amplifiers. All 7 are listed on Stereophile's "Class-A Recommended" list. These are all great amplifiers, but we will see that the THD+N is louder than we might expect.
Extracting the Raw Data
I extracted the raw data from Stereophile's published graphs, and then plotted this data using different X and Y units. The new plots contain the same data, but they are displayed in a way that relates directly to loudness at the listening position.
The following is a traditional plot of "THD+N vs. Power" published in Stereophile Magazine:
Traditional THD+N vs. Power Plot (Published by Stereophile)

Using the above plot, can you answer any of the following questions?
- How loud is the distortion?
- How loud is the noise?
- How does this amplifier compare to other amplifiers?
It is hard to answer any of these questions using this traditional graph. Nevertheless, the necessary information is fully captured in the data. The problem is that the data is not presented in a way that relates to the real world.
- What does % THD mean in terms of loudness?
- How does power relate to loudness?
The graph above seems to imply that the best performance is achieved at 3 watts, but we shall see that that is completely misleading. The graph clearly shows that the amplifier clips at about 400 watts, but most of the other useful information is hidden because of the poor choice of X and Y units. To be fair, Stereophile did not pick these units.
Why do we plot THD+N as a Percent?
There is a long history of plotting amplifier THD+N in percent at various output powers. It all started here:

This is the HP 320A distortion analyzer. It was the very first audio distortion analyzer and It was introduced by Hewlett Packard in 1940. This device could only measure the ratio of the fundamental tone to the distortion plus noise. Two separate measurements were made with a voltmeter, and the user had to calculate the ratio of the distortion voltage to the fundamental voltage. It was easy to express this ratio as a percentage, and we have continued this practice. With a bit of math, a slide rule, or some log tables, these ratio measurements could have been expressed in dB or could have been converted to level measurements, but this was almost never done.
Later instruments included meters that were calibrated to read % THD+N. Now, after 85 years, we are still plotting THD+N ratios as a percent. Unfortunately, these percent units bear no direct relationship to the loudness of the distortion. It is no wonder that we often fail to find a correlation between THD+N measurements and the way an amplifier sounds.
Problems with Traditional THD+N Plots
The first problem is that THD+N is expressed in percent. This is the percent ratio between the THD+N and the desired signal. This percent scale has no direct relationship to loudness. For example, 1% distortion at 100 watts is 20 dB louder than 1% distortion at 1 watt, but both are displayed at the same height on the graph. It would have been better if the vertical axis showed the absolute loudness of the THD+N instead of the relative loudness of the distortion to the music.
The second problem is that the THD+N ratio is expressed in linear units (%), but our ears have a logarithmic sensitivity to loudness. This forces us to plot the vertical axis using a log scale, and this makes it difficult to extract numbers from the graph. It would have been far better to express the THD+N in logarithmic dB units rather than in linear percent units.
The horizontal axis is also problematic. It expresses the amplifier output in terms of power. Again this axis is using linear units to express a logarithmic function. This forces us to use a logarithmic scale on this axis as well.
The horizontal axis shows power which is a function of load impedance. This makes it difficult to compare the amplifier's performance at 4-ohms to its performance at 8-ohms.
Again, all of the necessary data is contained in the traditional plots, but it is not presented in a way that is meaningful.
To solve these problems, I am going to introduce what I call a "THD+N SPL Plot":
"THD+N SPL Plot"
If we extract the data from the Stereophile plot, do a little bit of math, and change the X and Y units, we can plot the following:

This is the exact same data that was shown at the top of the page.
The vertical axis (THD+N Level), and horizontal axis (Output Level) are now both expressed in terms of Sound Pressure Level (SPL) at the listening position. The vertical axis shows the SPL of the distortion plus noise. The horizontal axis shows the SPL of the test tone (or music). The SPL is expressed in dB and these scales correspond to the dB scale shown in the graphic at the top of the page. 0 dB SPL is the threshold of hearing, and 105 dB SPL is the typical peak level of a sound track in a movie theater. In many cases, a 1 dB change in level is a just-noticeable difference in loudness.
The new plot assumes a pair of loudspeakers that produce 90 dB SPL with an input of 2.83 volts RMS at a distance of 1 meter in an anechoic room. This is about the same SPL that a pair of these speakers would deliver at a 2 meter distance in a typical listening room. You can easily adjust the X and Y units up or down a few dB if your speakers have a higher or lower sensitivity. This calculator converts THD+N % to dB SPL at the listening position. This is the same calculation that I applied to each data point extracted from the Stereophile plot.
With 90 dB speakers, 90 dB SPL is generated when the amplifier is delivering 2.83 volts (or 1 watt into 8 ohms). Likewise, 110 dB SPL is generated when the amplifier is delivering 28.3 volts (or 100 watts into 8 ohms). 100 watts is 20 dB higher than 1 watt. The "1 watt" and "100 watt" operating points are at 90 dB SPL and 110 dB SPL respectively when using 90 dB speakers.
We can now make the following observations:
- The flat area at the left side of the plot is the noise floor of the amplifier.
- We can see that the noise floor is about 8 dB SPL at the listening position.
- This noise level is above the 0 dB threshold of hearing, so it should be audible.
- We can see that the THD exceeds the noise at all listening levels above about 95 dB SPL.
- This 95 dB level corresponds to what appeared to be the "optimum" 3-watt operating point in the Stereophile plot. We can now see that it is just the inflection point at which the THD starts to exceed the noise. We were mislead by the traditional graph.
- The false appearance of optimum performance at 3 watts is gone.
- The maximum SPL from this amplifier-speaker combination is about 116 dB SPL.
- 116 dB is above the THX 105 dB recommendation for movies, so we should have more than enough power.
- The distortion reaches about 35 dB SPL at the listening position when the amplifier is delivering 110 dB SPL.
- At 35 dB SPL, the amplifier distortion is just a few dB quieter than the dishwasher shown in the first graphic.
Comparing Two Traditional THD+N Plots

Examine the two plots above, and see if you can answer the following questions:
- Which amplifier has a lower noise floor?
- What is the difference between the two noise floors?
- Which amplifier has lower distortion?
- Which amplifier will produce louder THD+N?
The answers to these questions are contained in the data, but they are completely obscured by the poor choice of horizontal and vertical units. It turns out that both plots are derived from the same power amplifier. The plot on the left was made with an 8-Ohm load. The plot on the right was made with a 4-Ohm load. We can see that the amplifier delivers about 400 Watts into 8 Ohms, and about 600 Watts into 4 Ohms. As expected, the amplifier delivers more power into the 4-Ohm load, but not twice the power.
Comparing 8-Ohm and 4-Ohm THD+N - Example 1
If we extract the data from the above plots and combine them into a single SPL plot, we have the following:

Blue = 8-Ohms, Orange = 4-Ohms
From the above plot we can observe the following:
- The amplifier will produce noise at a level of 8 dB SPL when driving an 8-Ohm or 4-Ohm load. The noise floor is identical.
- The THD is 4 to 6 dB higher when driving the 4-Ohm load at the same output voltage.
- The increase in THD at 4 Ohms is an indication that THD rises when this amplifier has to deliver more output current.
- The THD+N reaches 39 dB SPL at a 110 dB listening level when driving 4 Ohms.
- At 39 dB SPL, the THD+N is the same as the noise produced by one of the dishwashers in the first graphic!
When the music is playing loud, we have the equivalent of a dishwasher in the listening space. Is this a good thing?
Audibility of the Distortion
To be fair, the harmonic content of the 39 dB SPL distortion is closely related to the content of the music and it should be much harder to hear than the noise produced by the 39 dB dishwasher. It will also be much less than the distortion produced by the speakers. Nevertheless, we are using the music to mask the defects in the power amplifier. This masking will work some of the time, but it may not work all of the time. The distortion may be sufficient to change the way certain instruments or vocals sound. The distortion may also be sufficient to create apparent changes in the frequency response. It may also add clutter and confusion to the music.
Audibility of the Noise
The 8 dB SPL noise, delivered to the listening position, will not be masked by the music or by the speakers. It is present when the music is paused. This is a problem.
If the amplifier noise exceeds the 0 dB SPL threshold of hearing, and the room is relatively quiet, we can expect to hear this noise. It will be most audible if all of the energy is concentrated into a single frequency, such as AC hum. It will be least audible if the energy is spread out into a white-noise signal. THD+N measurements do not tell us how the energy is distributed, so we must assume that any noise floor above 0 dB SPL may be loud enough to be audible.
Comparing 7 Top-Rated Power Amplifiers
Armed with this SPL plotting technique, we can replot Stereophile's measurements into a form that will allow meaningful comparisons between the amplifiers.
My sales staff selected 7 power amplifiers from Stereophile's "Class-A Recommended" list, and I replotted the THD+N vs. Power data. This exercise revealed unexpected differences in these top-rated amplifiers. The noise floors and distortion levels can now be directly compared in the context of sound pressure level at the listening position.
We have seen the results for one amplifier, now let's look at the other 6.
- Do they all produce audible noise?
- Do they all produce distortion that is as loud as a major appliance?
- Do they all produce more distortion when driving lower impedances?
Comparing 8-Ohm and 4-Ohm THD+N - Example 2

Blue = 8-Ohms, Orange = 4-Ohms
From the above we can observe the following:
- This amplifier will produce noise at a level of about 9 dB SPL with an 8-Ohm or 4-Ohm load.
- The maximum SPL from this amplifier-speaker combination is about 105 to 110 dB SPL. This just reaches the THX recommendations.
- This amplifier is very sensitive to loading. The THD+N increases by 6 to 12 dB when driving the 4-Ohm load. The THD increases significantly when this amplifier has to deliver more current.
- The THD+N increases rapidly with output level.
- The THD+N reaches 50 dB SPL at the 110 dB output level.
- The THD+N is about 10 dB louder than that of a major appliance!
The washing machine is in the spin cycle!
Comparing 8-Ohm and 4-Ohm THD+N - Example 3

Blue = 8-Ohms, Orange = 4-Ohms, Green = 2-Ohms
From the above, we can observe the following:
- The noise floor is about 6 dB SPL below the 0 dB SPL threshold of hearing. This noise will not be audible. This is a very quiet amplifier.
- The THD+N is less than 0 dB SPL at all listening levels below 90 dB SPL.
- This amplifier can deliver 113 dB SPL.
- This amplifier is not sensitive to loading. The 8-Ohm, 4-Ohm, and 2-Ohm THD+N curves are nearly identical. The THD does not increase when this amplifier has to deliver high current.
- The THD+N rises very rapidly (3 dB/dB) as the output voltage increases. The THD+N rises 45 dB while the output rises only 15 dB.
- The THD+N reaches about 56 dB SPL at a 110 dB output level.
- The SPL of the THD+N is much higher than that of the prior two amplifiers.
- The THD+N SPL reaches or exceeds that of a major appliance over much of the operating range of the amplifier.
The spin cycle may be a bit out of balance.
Notes:
This amplifier is a top-rated class-D amplifier with a very respectable noise floor. This amplifier is not sensitive to load impedance. The 8-Ohm, 4-Ohm, and 2-Ohm THD+N are virtually identical. This shows that the distortion does not increase when this amplifier has to deliver high current. The rapid rise in THD+N with output voltage is typical of many class-D amplifiers. Class-D amplifiers also tend to show an additional rise that is a function of output frequency, but that is beyond the scope of this paper.
Amplifier with Low THD

Blue = 8-Ohms
From the above, we can observe the following:
- The noise floor is just 5 dB SPL and is nearly inaudible.
- This amplifier can deliver output levels of at least 115 dB SPL.
- The THD+N only reaches about 14 dB SPL at a 110 dB output level.
- The SPL of the THD+N is much lower than that of the prior three amplifiers.
The washing machine and dishwasher are turned off!
Notes:
The 4-Ohm data was not available from Stereophile.
An Amplifier with a High Noise Floor

Blue = 8-Ohms, Orange = 4-Ohms, Green = 2-Ohms
From the above, we can observe the following:
- The noise floor of this amplifier is about 15 dB SPL. This is the nosiest amplifier in this group. The noise from this amplifier should be quite noticeable.
- Into an 8-Ohm load, the noise exceeds the THD until the output reaches about 95 dB SPL.
- This amplifier can deliver a peak SPL of about 110 dB.
- The THD increases by 3 or 4 dB at 4-Ohms and more than 10 dB at 2 Ohms. This indicates that the THD increases when this amplifier has to deliver more current.
- At a 110 dB SPL output, the distortion is 30 to 50 dB SPL, depending on the loading. This is slightly less THD than some of the other amplifiers.
We have the equivalent of an electric fan when the music is paused, and a dishwasher when the music is playing loudly.
Class-D with a Twist

Blue = 8-Ohms, Orange = 4-Ohms
From the above, we can observe the following:
- This is a quiet amplifier. The noise floor is about 3 dB SPL. At this level, the noise should be nearly inaudible, even in a very quiet room.
- This amplifier can deliver 117 dB SPL.
- The THD rises rapidly (2dB/dB) with output level.
- The 8-Ohm and 4-Ohm THD+N levels are nearly identical. but there is a curious level-dependent variation between the two curves that makes the curves look like they are twisted together. This variation suggests that there is some interaction between output voltage and output current.
- This amplifier is not adversely affected by 4-Ohm loads.
- THD is 30 to 34 dB at a 110 dB ouput level.
Notes:
This is a class-D amplifier with a tube front end. Like the other class-D (the LKV PWR-3), the THD rises rapidly with output level, but at a slightly lower rate. And, like the other class-D, the performance does not degrade when driving 4-Ohm loads.
Benchmark AHB2 - Low Distortion and Low Noise

Blue = 8-Ohms, Orange = 4-Ohms, Green = 8-Ohms Mono
From the above, we can observe the following:
- This is a very quiet amplifier, with almost no measurable distortion.
- The noise floor is about 17 dB below the 0 dB SPL threshold of hearing!
- This amplifier can deliver 110 dB SPL in stereo mode.
- This amplifier can deliver 116 dB SPL in mono mode.
- The THD is below 0 dB SPL at all output levels below 114 dB.
- The THD does not change with load impedance. 8-Ohm and 4-Ohm curves are identical. This indicates that distortion does not increase when this amplifier has to deliver high current.
- The noise floor is 3 dB higher in bridged mono mode, but is still 14 dB below the threshold of hearing. The mono output is almost 6 dB higher, so the SNR is about 3 dB better in mono mode. In mono or stereo, the noise is well below the threshold of hearing and it would even be inaudible even when driving high-efficiency horns.
- There is almost no rise in THD with output level. Most of the observed rise is due to the limitations of the test equipment.
- The steps in the curves are due to the auto ranging of the APx555b test station. These steps indicate that the amplifier THD+N is at or below that of the test station.
- In bridged mono, the THD is just 4 dB SPL at a 116 dB output level. It is 0 dB SPL at a 114 dB SPL output level.
- These plots show that this amplifier will produce no audible noise or distortion.
The AHB2 defines the current state of the art among power amplifiers.
Notes:
The AHB2 is a class-AB amplifier with a fully regulated power supply. The regulated supply assists in delivering clean power at high currents into difficult loads. The AHB2 includes class-H tracking rails for improved efficiency. A proprietary feed-forward correction system reduces THD by 30 to 60 dB.
Direct Comparison of all 7 Amplifiers
If we plot the 8-Ohm output performance of all 7 amplifiers on a single graph, we have the following:

The dark blue and dark green curves at the bottom are the 8-Ohm AHB2 stereo and mono measurements respectively. The other 6 curves are the 8-Ohm measurements for the other 6 amplifiers.
From the above, we can observe the following:
- The noise floor of the AHB2 is 10 to 30 dB lower than that of the other 6 top-rated amplifiers.
- The THD of the AHB2 is 30 to 60 dB lower than the other 6 amplifiers.
- The AHB2 is the only amplifier that delivers full output while keeping THD+N below the 0 dB SPL threshold of hearing.
- In bridged mono mode, the AHB2 delivers more useable power than any of the other 6 amplifiers. The other high-power amplifiers do not get reasonably clean until they are delivering much lower output levels.
- At the 110 dB SPL output level, 5 of the amplifiers produced THD+N at levels that rival that of a major appliance.
Summary
I have extracted the data from traditional THD+N vs. Power plots and presented this data in terms of sound pressure level at the listening position. I did this for 7 amplifiers that had received Stereophile's top ratings. The format of original Stereophile plots made it impossible to make many meaningful comparisons between the amplifiers, even for those of us who are very familiar with these types of plots.
After replotting the data in terms of SPL, we could immediately quantify the noise floors, and we could immediately see the SPL of the THD+N at any playback level. We could also see how each amplifier reacted to changes in load impedance. Some amplifiers performed well with 4-Ohm loads, but others showed an increase in THD. Some amplifiers showed a rapid increase in THD as the playback level was increased.
The replotted data is easy to visualize and it is easy to correlate with what will be experienced in the sweet spot of your listening room. The X and Y axis both use the same units (dB SPL). This makes it easy to adjust the data for changes in speaker sensitivity or changes in listening distance. It also allows us to quantify the slope of the THD rise.
We didn't have to make new measurements, we just needed to replot the existing data. More importantly, we just needed to rethink the way we plot THD+N measurements.
"We Have Been Plotting THD+N in a Nearly-Useless Format for 85 Years"
I would contend that we have been plotting THD+N data in a nearly-useless format for 85 years. We do it that way because we have always done it that way.
It is time for a change. The "THD+N SPL Plot" can reveal a wealth of meaningful information that has been obscured by traditional plots. We can replot old measurements to reveal this hidden information, and we can apply this technique to new measurements.
- John Siau
Here is a video discussion of this topic:
Note:
In this video, I plotted the horizontal axis in terms of volts RMS. After further consideration, I decided that an SPL vs. SPL, "THD+N SPL Plot", conveys more information.
Also in Audio Application Notes

Interpolator Overload Distortion
Most digital playback devices include digital interpolators. These interpolators increase the sample rate of the incoming audio to improve the performance of the playback system. Interpolators are essential in oversampled sigma-delta D/A converters, and in sample rate converters. In general, interpolators have vastly improved the performance of audio D/A converters by eliminating the need for analog brick wall filters. Nevertheless, digital interpolators have brick wall digital filters that can produce unique distortion signatures when they are overloaded.
10% Distortion
An interpolator that performs wonderfully when tested with standard test tones, may overload severely when playing the inter-sample musical peaks that are captured on a typical CD. In our tests, we observed THD+N levels exceeding 10% while interpolator overloads were occurring. The highest levels were produced by devices that included ASRC sample rate converters.
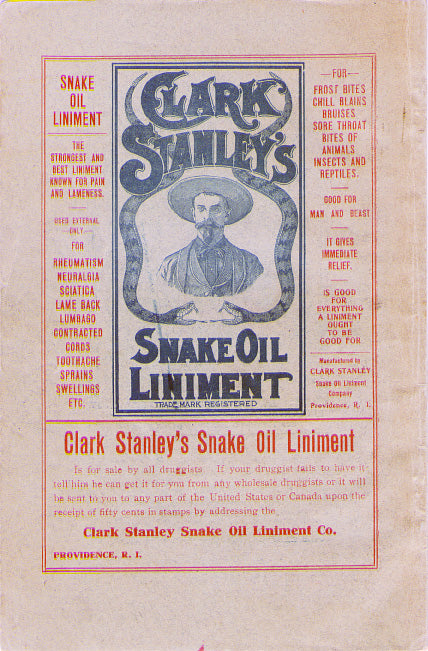

Audiophile Snake Oil
The Audiophile Wild West
Audiophiles live in the wild west. $495 will buy an "audiophile fuse" to replace the $1 generic fuse that came in your audio amplifier. $10,000 will buy a set of "audiophile speaker cables" to replace the $20 wires you purchased at the local hardware store. We are told that these $10,000 cables can be improved if we add a set of $300 "cable elevators" to dampen vibrations. You didn't even know that you needed elevators! And let's not forget to budget at least $200 for each of the "isolation platforms" we will need under our electronic components. Furthermore, it seems that any so-called "audiophile power cord" that costs less than $100, does not belong in a high-end system. And, if cost is no object, there are premium versions of each that can be purchased by the most discerning customers. A top-of-the line power cord could run $5000. One magazine claims that "the majority of listeners were able to hear the difference between a $5 power cable and a $5,000 power cord". Can you hear the difference? If not, are you really an audiophile?

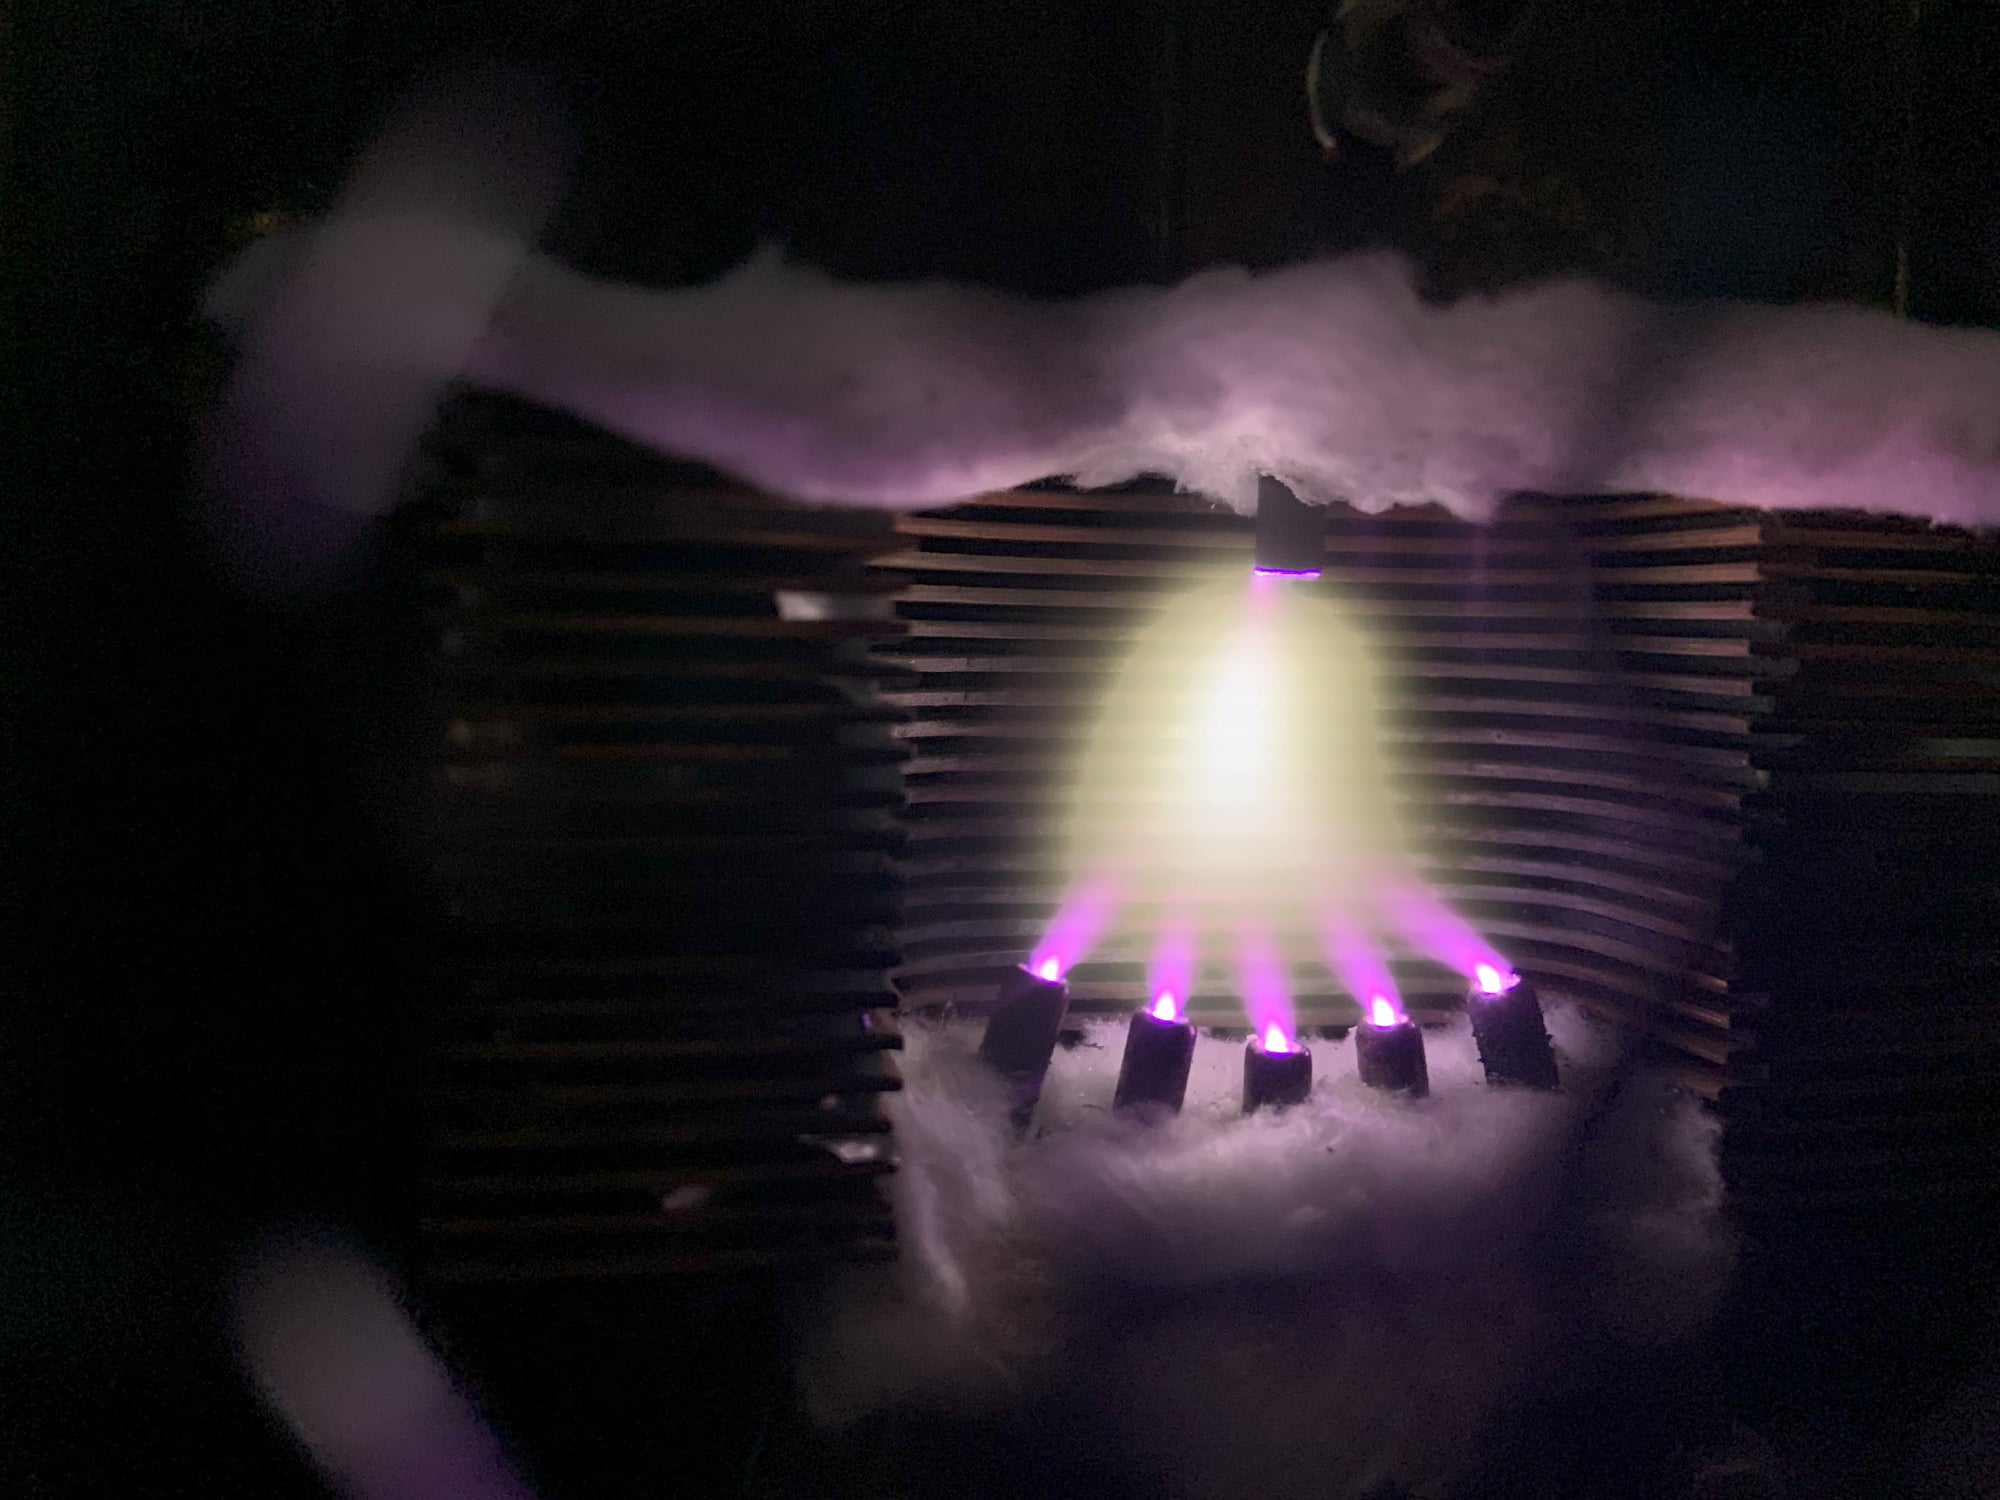
Making Sound with Plasma - Hill Plasmatronics Tweeter
At the 2023 AXPONA show in Chicago, I had the opportunity to see and hear the Hill Plasmatronics tweeter. I also had the great pleasure of meeting Dr. Alan Hill, the physicist who invented this unique device.
The plasma driver has no moving parts and no diaphragm. Sound is emitted directly from the thermal expansion and contraction of an electrically sustained plasma. The plasma is generated within a stream of helium gas. In the demonstration, there was a large helium tank on the floor with a sufficient supply for several hours of listening.

While a tank of helium, tubing, high voltage power supplies, and the smell of smoke may not be appropriate for every living room, this was absolutely the best thing I experienced at the show!
- John Siau