Distortion measurements (THD, THD+N and IMD) are traditionally expressed in terms of percent. But what do 1%, 0.1%, 0.01% or 0.001% mean in terms of loudness or audibility?
If you are like most people you just know that 0.001% is the best of the three numbers listed above. If you are a well-trained geek you will recognize that each added leading zero represents a 20 dB improvement. 0.01% is 20 dB lower than 0.1% and this is 20 dB lower than 1%. The well-trained geek will convert % to dB in order to give meaning to these numbers.
When distortion reaches 1% it is just 40 dB lower than the music. When distortion reaches 0.1% it is 60 dB lower than the music. When distortion reaches 0.01% it is 80 dB lower than the music. Obviously the 40 dB, 60 dB and 80 dB figures are easier to understand than 1%, 0.1% and 0.01%.
Handicapped by Tradition
Unfortunately, distortion measurements are traditionally expressed as a percent. The specifications tell us that the distortion voltage is a certain percentage of test signal voltage.
If we use decibels we can say that the distortion voltage is a certain number of decibels below the test signal voltage. As it turns out, this information is much easier to use.
When THD is expressed in terms of dB, we can easily determine how loud the distortion will be in our playback system. Loudness is useful information, and THD ratios are much more meaningful when they are expressed in the same logarithmic terms that we use to quantify loudness.
Loudness is Logarithmic, Decibels are Logarithmic, Percent is Linear
Decibels and percent are both ratio units. In distortion measurements, they specify the ratio of the distortion signal to the desired signal. Decibels are used to specify ratios on a logarithmic scale. Percent is used to specify ratios on a linear scale. So, does it really matter which units we use?
Both units convey the same information, but the dB scale relates more closely to the way our ears respond.
Our ears respond logarithmically to increases in loudness. A 1-dB increase in level is just noticeable to most listeners. A 10-dB increase in level is perceived as doubling of volume by most listeners.
Acoustic Measurements use a dB Scale
When we measure sound pressure levels (SPL) in a room we use a decibel scale. The SPL is the ratio of the acoustic level to the threshold of normal hearing at 1 kHz. If the SPL of a signal is above 0 dB SPL it should be audible to listeners with normal hearing. If the SPL of a signal is below 0 dB SPL it should be inaudible to most listeners. The threshold of hearing varies from listener to listener and it also varies with frequency. Use the 0 dB SPL as a general rule of thumb for the threshold of hearing.
Masking
Audibility thresholds assume that a single test tone is played in isolation in a reasonably quiet environment. In a noisy room it will be harder to hear the test tone. The noise in the room tends to mask the tone making it more difficult to hear.
In the same way, music masks some of the distortion produced by our audio systems. Some forms of distortion can be well-masked by certain kinds of music. Other forms of distortion are poorly masked.
Harmonic Distortion is Partially Masked by Music
Every musical instrument produces harmonics. The ratios of individual harmonics to the fundamental give an instrument its unique sound. If all of the distortion produced by our electronics is harmonic distortion, this may be masked by the harmonic distortion produced by the instrument itself. If the harmonic distortion is not fully masked it may just alter the sound of the instrument. The listener may not recognize the change as distortion, but may detect a difference in the sound of an instrument.
String instruments tend to produce high levels of harmonics and these can mask much of the harmonic distortion produced by the electronics. Other instruments produce purer tones and these instruments will not mask as much of the harmonic distortion produced by the electronics.
Some instruments, such as the piano, produce overtones that are not perfectly harmonic. The overtones produced by a piano string are stretched by slightly more than octave ratios. This is why the tuning of a piano must be stretched to prevent beating between the overtones and the note one octave above. The stretched overtone spacing can also beat with the perfect octave spacing produced by harmonic distortion. The piano string's 1st overtone may beat against the 2nd harmonic distortion produced by the electronics (they are at slightly different frequencies). To my ears, this beating mimics the sound of a poorly tuned piano. I became sensitized to this after tuning my own piano. I believe this effect is one of the reasons why it is so difficult to accurately reproduce the sound of the piano. If you can reproduce a realistic piano sound, you have a very good audio system.
Other Types of Distortion are Poorly Masked
THD+N specifications do not distinguish between harmonic and non-harmonic distortion. The "+N" (plus noise) part of the specification may include hum, noise, whistles, other non-musical signals. These non-harmonic distortion and noise signals are not well masked by music. THD+N measurements also don't tell us anything about which harmonics are the loudest. Second harmonic distortion is often well masked by music but high-order harmonics may not be well masked. THD+N specifications sum all of the distortion and noise into a single number. This combined catch-all measurement tells us nothing about how well it will be masked by the music. Nevertheless, these measurements are useful when verifying transparency.
IMD (intermodulation distortion) characterizes the performance when playing a pair of test tones. When more than one tone is played, the audio system can generate non-musical distortion at frequencies that are well-separated from the test tones. This frequency separation implies that the distortion will be poorly masked by the stimulus tones. Furthermore, IMD has no harmonic relationship to music and tends to be poorly masked. IMD measurements tend to provide a more accurate picture of how much distortion a device will produce when playing music. It is difficult to obtain accurate IMD measurements of very high-performance systems. Benchmark products tend to outperform the IMD measurement capabilities of the best test equipment.
Loudspeakers
In any audio system, the loudspeakers are often the largest source of distortion. We cannot build perfectly transparent loudspeakers but we can build transparent electronics. We may have many cascaded electronic devices between the microphone and the speakers. Each of these electronic devices can impart audible distortion signatures. But, if the electronics are transparent, the loudspeaker is the only offending component. This paper focuses on the distortion produced by electronics.
Do the Electronics Produce Audible Distortion?
Ideally, we would like to determine the audibility of the distortion produced by our audio electronics. We could ask the following questions:
Will my audio electronics produce audible distortion?
Will the distortion produced by my audio electronics be inaudible?
At first these two questions may look the same, but they are not.
The second question is easier to answer than the first. If the distortion is reproduced at a level that is below the threshold of hearing (0 dB SPL), it should be inaudible with any musical source. If the distortion is too low to be heard in a quiet room, it is too low to be heard while the music is playing.
On the other hand, if the distortion is reproduced at a level that exceeds the threshold of hearing, it may be audible. It may not be fully masked by the music. When distortion exceeds 0 dB SPL it is very difficult to determine its audibility. In most cases we can just say that distortion may be audible if it exceeds 0 dB SPL at playback. In many cases, the distortion will be well-masked at levels considerably above 0 dB SPL, but anything above 0 dB SPL is unknown territory.
In theory, the audibility of distortion above 0 dB SPL could be determined for a specific recording, a specific playback level, a specific distortion spectrum, and a "normal" set of ears. This calculation would require the use of a pychoacoustic model of our auditory system. Such models exist, but they can only describe audibility for a very specific set of circumstances.
Again, the key question is this:
Will the distortion produced by my audio electronics be inaudible?
System Strategy
Do we want to just reduce the distortion to a point where it is hidden by the music, or do we want to reduce it to a point where it is below the threshold of hearing?
Low-Cost Strategy
In low-cost systems we almost always rely upon masking effects. If we are lucky, masking may hide most of the distortion. If we are not so lucky, the device may be barely tolerable. Or, the system may sound great with a guitar but bad with a piano recording. The effectiveness of masking will vary from recording to recording. Most audio systems rely heavily on masking effects to hide distortion.
High-Performance Strategy
In high-performance system, we can use the threshold of hearing as our performance target. If the distortion level never exceeds the threshold of hearing (0 dB SPL), the distortion will be completely inaudible. This is the approach taken by Benchmark. With today's technology it is possible to build audio electronics that produce no audible distortion, even at elevated playback levels.
Playback Level
Distortion specifications define the ratio between the distortion and the desired signal. If the playback SPL is increased, the distortion SPL will increase by at least the same amount. If our goal is to keep the distortion below 0 dB SPL, high-output systems need better distortion performance. Distortion that was below the threshold of hearing at a 70 dB SPL may be above threshold when the playback SPL is increased by 20 dB.
Estimating the SPL of the Distortion
If we express distortion ratios in terms of decibels, we can easily estimate how loud the distortion (produced by the electronics) will be in our listening room. To do this, we just need to know a few basic things about our playback system. This calculation is very easy when the distortion ratio is expressed in dB. It is much more difficult when distortion is expressed as a percent.
A New Set of Specifications
Some manufacturers have started to provide distortion specifications in terms of decibel ratios in addition to the traditional percent ratios. Benchmark always provides distortion specifications using both sets of units. We strongly recommend using the decibel units when comparing distortion specifications because this gives meaning to the comparison. Decibel units are essential when making distortion SPL calculations.
Converting % to dB
If decibel distortion specifications are not available, it is relatively easy to convert from % to dB.
Use the following formula to convert from % to dB:
20*Log(%/100) = dB
Try Some Examples - You can do this!
Example 1:
Convert 0.001% to dB
20*Log(0.001/100) = -100 dB
Example 2:
Convert 0.1% to dB
20*Log(0.1/100)= -60 dB
Looking at the above examples, we can immediately see that the distortion in example 2 (0.1%) is 40 dB higher than in example 1 (0.001%).
If you do the math, you will find that each extra leading 0 gives us a 20 dB improvement. For example, 0.01% is 20 dB better than 0.1%. Likewise, you will find that 0.04% is 20 dB better than 0.4%.
Geek Alert!
If you just did the math, you are now on your way to becoming a well-trained geek! Is that scary or what? If your eyes just glazed over, and you skipped the math, you are not at risk!
How Loud will the Distortion Be In My System
If distortion is expressed in decibels, it is possible to calculate the maximum sound pressure level (SPL) that can be produced by the distortion signal. To do this, you will need to know the maximum SPL that your system can produce. This can be calculated using the speaker voltage sensitivity and amplifier output voltage. Once the peak SPL is known, the distortion level can be subtracted from the peak level to determine the peak SPL produced by the distortion. If this peak distortion SPL is less than 0 dB SPL, it is absolutely inaudible, even when ignoring the masking provided by the music. In most systems, Benchmark components actually provide this level of performance! Many would argue that this is overkill, but we would respond by saying that we don't want to rely upon masking effects to hide the distortion.
Quick and Easy System Performance Estimate
If you fear becoming a geek, we can make things simple.
At a listening level of about 80 decibels, peaks can reach 100 dB. This 100 dB peak level is well within the capabilities of a typical 100 W stereo system. So, at normal listening levels, a typical system produces peaks that are 100 dB above the threshold of hearing. Given this peak level, we can very easily determine the peak sound pressure level produced by the distortion.
Example 1 - THD+N = -60 dB (0.1%)
If the distortion produced by the system is -60 dB (0.1%), add this negative number to the peak output level. Using the 100 dB peak SPL, and adding -60 dB, we can determine that the peak distortion levels could reach 40 dB SPL. Normal conversation occurs at a 40 to 60 dB SPL. If you can hear a person talking while you are listening to music, then it is reasonable to expect that this level of distortion may not be fully masked by the music.In this example, the distortion is played at a level that is 40 dB above the threshold of hearing. This distortion will be audible unless it is completely masked by the music.
Example 2 - THD+N = -100 dB (0.001%)
Adding -100 dB to our 100 dB peak playback SPL, we get 0 dB SPL. This means that the distortion will never exceed 0 dB SPL on the highest peaks. The distortion produced by this system will be completely inaudible at any playback level up to 100 dB SPL.
Example 3 - THD+N = -120 dB (0.0001%)
Adding -120 dB to our 100 dB peak playback SPL, we get -20 dB SPL. This means that the distortion produced by our electronics is 20 dB below the threshold of hearing! This system can be turned up 20 dB before the distortion peaks produced by the electronics reach 0 dB SPL.
Will the Distortion be Audible?
It is very difficult to determine the audibility of distortion when it is masked by music. Nevertheless, we have determined that the electronic systems in examples 2 and 3 above cannot produce any audible distortion at a 100 dB peak SPL playback level. In contrast, the system in example 1 may produce audible distortion.
Just to be clear, I am not saying that the 0.001% THD+N in example 2 defines the threshold of audibility. Instead it defines the threshold of absolute inaudibility, given a 100 dB peak SPL playback level.
Design Target
Benchmark products are designed to keep the sum total of all distortion and noise signals below -110 dB (0.0003%) relative to the maximum output. Many of our products exceed this design target.
State-of-the-Art Examples
The Benchmark DAC3 has a THD+N of -113 dB (0.00022%). The DAC3 uses active 2nd and 3rd harmonic nulling circuits to help achieve this outstanding level of perfomance.
The Benchmark AHB2 power amplifier has a THD+N of less than -110 dB (0.0003%) under full rated load, at full rated output power. The graph below shows the AHB2 delivering 183 W into 4 Ohms at 1 kHz with a THD of -119.5 dB (0.0001 % THD)! In contrast, most power amplifier produce 1% THD+N at their rated output power.
The AHB2 is a unique power amplifier that uses regulated power supplies and a patented feed-forward error correction system to achieve unrivaled performance. The AHB2 also has a 135 dB A-weighted signal to noise ratio when operating in mono mode. No other power amplifier can match these specifications. Such performance is very difficult to achieve in a high-power electronic device. The AHB2 is truly a groundbreaking product with a radically different topology.
Together, the DAC3 and AHB2 absolutely define the state-of-the art when it comes to audio playback electronics.
AHB2 THD while Driving Stereo 4-Ohm Loads
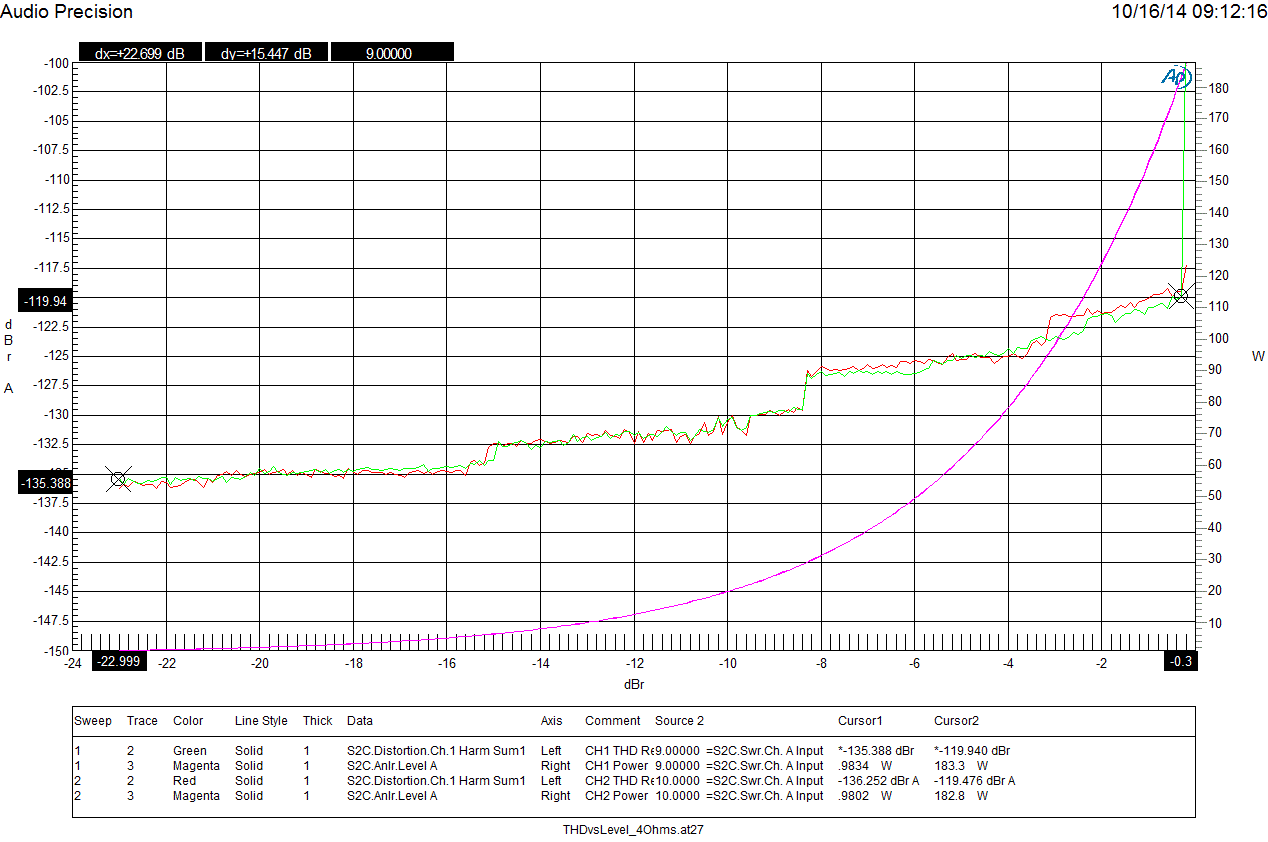
The above graph shows the THD produced by an AHB2 power amplifier. A 1 kHz tone is swept in amplitude from -24 dB to 0 dB relative to the maximum input level of the amplifier. The AHB2 amplifier is driving a stereo pair of 4-Ohm loads. The output power is shown on the violet trace. At an input of -24 dB the output power is just under 1 watt. As the input level increases, we can see the output power increase until it reaches 183 W per channel. The output power is shown on the right-hand scale.
The red and green traces show the THD produced by the amplifier under these conditions. In this case, the THD is the ratio of the distortion to the maximum output level. The THD is shown on left-hand scale. At full rated output, the THD is -119.5 dB (0.0001%).
This incredible performance is at the measurement limits of the AP2722 test system. The stairsteps in the red and green traces are caused by the auto-ranging in the AP2722. These stairsteps are clear evidence that the AHB2 is performing at the measurement limits of the AP2722 while subjected to 4-Ohm loading. No other power amplifier comes close to this level of performance.
A Few More Numbers for the Geeks!
These results show that the THD produced by the AHB2 will be reproduced at a level less than 0 dB SPL for peak levels less than 119.5 dB SPL. This means that the AHB2 produces no audible distortion at playback levels up to 119.5 dB SPL.
183 W into 4 Ohms indicates that the output voltage of the amplifier is 27.1 Vrms:
SQRT(183*4) = 27.1 Vrms.
This is 19.6 dB above the 2.83 Vrms level that is used to measure the voltage sensitivity of speakers:
20*Log(27.1/2.83)=19.6 dB
In order to reach 119.5 dB SPL with 27.1 Vrms, we would need a speaker with a voltage efficiency of 99.9 dB at 2.83 Vrms:
119.5 dB SPL - 19.6 dB = 99.9 dB SPL
Most speakers have a voltage sensitivity that is much less than 99.9 dB. Again, this shows that the distortion produced by the AHB2 will be reproduced at less than 0 dB SPL with most speaker. For example, a speaker with 89 dB voltage efficiency would reproduce the distortion at a level of -10.9 dB SPL (10.9 dB below the threshold of hearing). Again, this indicates that the AHB2 produces no audible distortion.
Summary - A Conservative Approach to Transparency
If our goal is to build transparent audio systems, there should be no audible distortion. If we keep the total distortion at or below the threshold of hearing (0 dB SPL), we can guarantee that it will be inaudible. When this level of performance is achieved, we are not relying on masking to hide the distortion. Instead, the distortion is inaudible because it is reproduced at levels that are below the threshold of hearing.
If we want to listen at 80 dB, peaks will reach about 100 dB. At this playback level, the distortion must be lower than -100 dB (0.001%) to absolutely guarantee that it is inaudible.
If we want to listen at 90 dB, peaks will reach about 110 dB. At this playback level, the distortion must be lower than -110 dB (0.0003%) to absolutely guarantee that it is inaudible.
This very conservative approach to transparency eliminates the masking guesswork.


