The Legendary Benchmark DAC1

In August of 2015, Enjoy the Music.com selected the DAC1 as one of the 20 most significant digital audio products from the past 20 years. This award came shortly after the end of 13 years of continuous DAC1 production. This is a very long time in today's fast-paced electronics industry, but the DAC1 was ahead of its time. After 13 years, the DAC1 is still a central component in the monitoring chain of many highly respected recording studios.
One Decade Between the DAC1 and the DAC2

The DAC1 was in production for 10 years before technology improved enough to justify a new Benchmark D/A converter. In 2012 when technology had improved, Benchmark introduced the DAC2, a two-channel D/A converter built from an 8-channel 32-bit D/A core. After the introduction of the DAC2, the production of the DAC1 continued for another 3 years. The last DAC1 was produced in July of 2015.
Measurable Improvements
The DAC2 measures better than the DAC1 in almost every way. Our website, our manuals, and the many product reviews contain numerous graphs and measurements but none of these show side-by-side measurements of the two products. Few people outside of Benchmark have ever had the opportunity to see a direct side-by-side comparison of the performance. Many customers have asked "How does the DAC2 compare to the DAC1?"
How Much has Technology Changed in 10 Years?
This paper shows side-by-side tests that were simultaneously performed on an Audio Precision AP2722 test station or an AP2522 test station. The simultaneous testing eliminates any chance that differences are due to test methodology or variations in the test equipment. These tests accurately show the performance differences between the DAC1 and DAC2. In each test, the performance of the two products is overlaid on the same graph.
Audible Differences?
One word of caution: The side-by-side measurements make the DAC2 look much better than the DAC1, but it is important to understand that you will not hear 'a huge difference that transforms your entire life' (or some such wild claim). The audible differences are relatively modest because both products are designed to be very transparent. We try to be very straightforward about what our products deliver. Measured differences do not always produce audible differences. See "Benchmark DAC2 vs. DAC1 - Is There an Audible Difference?" for our assessment of the audible differences.
What is Transparency?
Transparency is the ability to pass an audio signal without alteration. Audio products may add noise, and distortion and they may change the frequency and phase response. These additions and changes detract from transparency. But, it is important to understand that some products are specifically designed to change the audio. A guitar amplifier is a perfect example of a product that is not transparent. Guitar amplifiers are designed to add distortion, change the frequency response and add effects. In contrast, Benchmark products are specifically designed for transparency. This transparency makes our products well suited for accurate studio monitoring and it also makes them well suited for creating a natural sounding home playback system. Some listeners may prefer a system that changes or enhances the sound of the music. In a home environment, transparency is a matter of personal taste.
Transparency is Measurable
Noise, distortion, frequency response and cross-talk are some common measurements of transparency. If these measurable defects are small enough, it may be impossible to audibly detect the product's addition or removal from the audio chain. In almost all cases, our ability to measure exceeds our ability to hear. For example, we can measure frequency response at frequencies that are well above the limits of human hearing. Likewise we can measure noise when it is well below the threshold of hearing. And, within the audio band, we can measure slight ripples in the frequency response when they are far too small to become audible. A product that measures well should be highly transparent. If all of the defects are low enough, further measured improvements may not deliver an audible change.
Some Great Products Measure Poorly
A product that measures poorly cannot be transparent, but it may still be a great audio product. As stated earlier, many audio products are not designed to be transparent. A guitar amplifier can produce high levels of distortion, but this can be used to create a musically pleasing effect. Devices that are designed to alter the sound will show at least one measured parameter that measures 'poorly'. In such a case, the achieved effect must be evaluated by ear and not primarily on the basis of measurements.
Benchmark Products set Measurement 'Benchmarks'
All Benchmark products measure well because they are designed to be transparent. Our products often define the 'benchmarks' for measured performance. The DAC1 defined the state of the art in 2002. The DAC2 defines the current state of the art. It is very interesting to look at the improvements that have been made over a period of 10 years:
Distortion Plus Noise (THD+N)
In the world of measurements, we often measure distortion and noise together because this is easier than measuring distortion alone. Our AP2722 can do either, but let's look at a traditional THD+N measurement first.
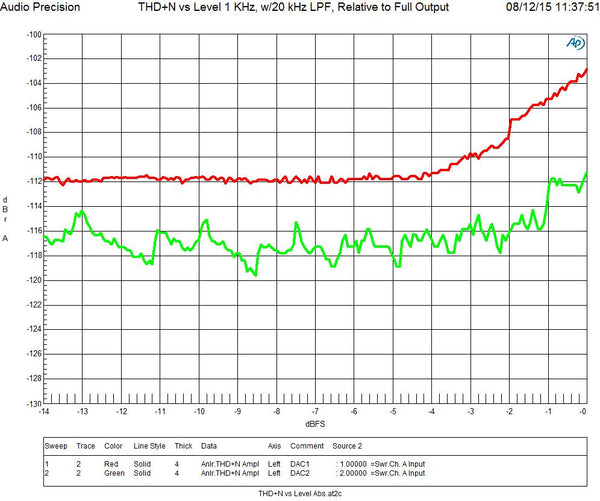
Figure 1: THD+N vs. Level
Figure 1 shows the THD+N measurement of the DAC1 and DAC2 converters using a 1 kHz tone that is swept from -14 dBFS to 0 dBFS. The Red curve is the DAC1 and the Green curve is the DAC2. The DAC2 measures about 9 dB better than the DAC1.
The red curve shows that the THD+N produced by the DAC1 is always at least 103 dB below the maximum output level. This means that the distortion and noise could not reach the threshold of hearing unless the playback system is generating peaks higher than 103 dB SPL. And that ignores the masking effects of the tone (or music) that is playing at 103 dB SPL! Note that the red curve reaches a minimum of -112 dB relative to full output. This is the level at which the noise of the DAC1 exceeds the THD produced by the DAC1 in our combined THD+N measurement.
The green curve shows that the THD+N produced by the DAC2 is at least 111 to 112 dB below peak output. With a DAC2, the playback system would need to generate 112 dB peaks before the distortion would reach audible levels (if the distortion were played in isolation). Notice that the green curve shows a saw tooth pattern below an input level of -2 dBFS. This pattern is caused by the auto-ranging of the AP2722 test set and is not caused by the DAC2. Over most of the curve, the THD+N produced by the DAC2 is less than measurement limits of the AP2722. The green curve is essentially a measurement of the input stage on the test set! The DAC2 is good enough to measure the performance of the AP2722.
Based upon this measurement, it is safe to say that the distortion and noise produced by either product is inaudible when the product is driven with a 1 kHz test tone.
Distortion Only (THD)
The AP test station can measure distortion while ignoring noise. This test allows us to look at the distortion produced by low-level signals. At high levels, this test configuration has less resolution due to the use of the internal A/D converter in the test station.
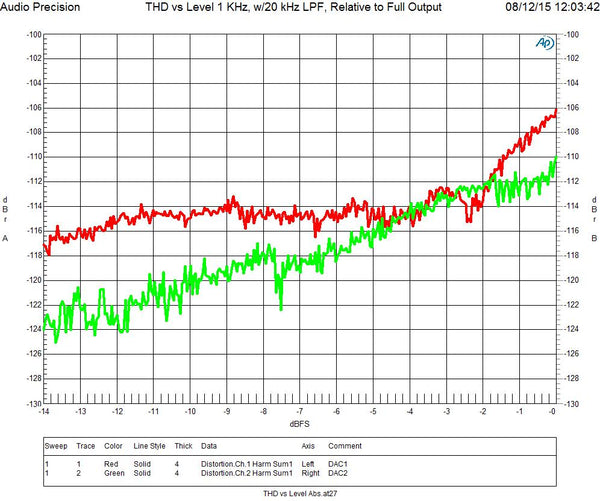
Figure 2: THD vs. Level
Figure 2 shows the improved low-level THD performance of the DAC2. The red trace is the DAC1. The green trace is the DAC2. The DAC1 bottoms out at about -115 dB while the THD produced by the DAC2 continues to decrease as the signal level decreases. Again, the distortion produced by either product should be well below audibility, so this is mostly a demonstration of the improved conversion technology in the DAC2. The step in the green curve at an input level of -7.5 dB is due to the auto ranging in the AP test station. The DAC2 may be exceeding the measurement capabilities of the AP over the entire sweep. These measurements get difficult when the performance of the product is so closely matched to the measurement limits of the test equipment.
THD+N vs. Frequency
Obviously, music is not comprised of 1 kHz test tones, so we need to see what happens at other frequencies. This next test sweeps a high-level tone from 20 Hz to 20 kHz while measuring the THD+N. At high signal levels the AP's all-analog THD+N measurement system has more resolution than the mixed-domain THD measurement system. At high signal levels the noise produced by the DAC1 or DAC2 is so low that it does not influence the measurement.
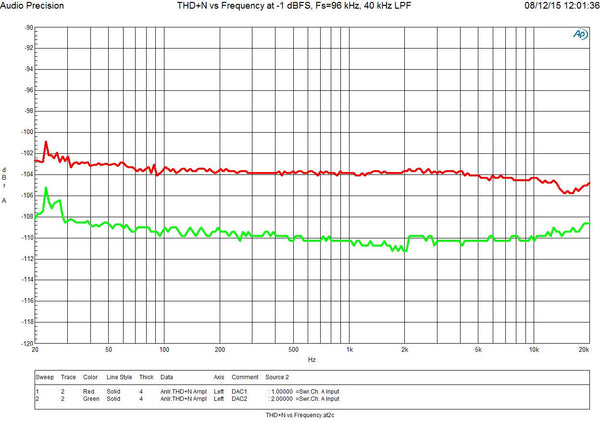
Figure 3: THD+N vs. Frequency
Figure 3 shows that THD+N does not increase with frequency with either product. This indicates that both products have sufficient slew rates to handle high-amplitude high-frequency signals. The red trace is the DAC1 and the green trace is the DAC2. The DAC2 measures about 5 to 6 dB better than the DAC1 over the entire audio band. Again the distortion from either product should be well below audibility.
1 kHz FFT
A Fast Fourier Transform (FFT) gives us a visual look at the audio spectrum of the output of the D/A converters. The AP audio analyzer uses an A/D converter to put the analog output of the DAC back into the digital domain. Once this is done, an FFT can be created so that we can plot the spectral output of the DAC. To avoid the distortion produced by the A/D converter in the AP, we must use the analog notch filter in the AP before using the A/D.
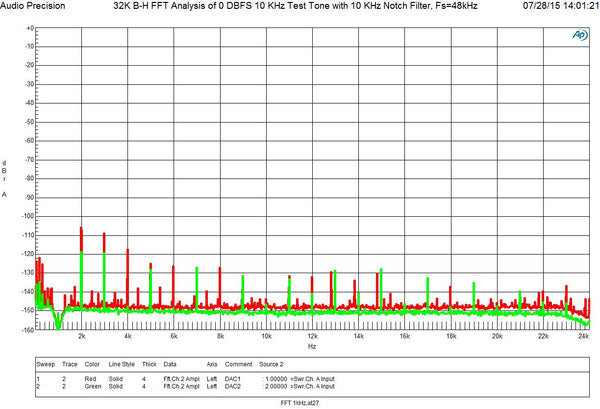
Figure 4: 1 kHz FFT
Figure 4 shows the harmonic distortion produced by the two products when converting a high-level (-1 dBFS) 1 kHz tone. A notch filter has been placed at 1 kHz to remove the fundamental so that resolution of the test can be greatly improved. The red trace is the DAC1 and the green trace is the DAC2. The harmonics of the 1 kHz tone can be seen at 2 kHz, 3 kHz and on up to the 24 kHz bandwidth limit of our FFT. The highest level harmonics are the 2nd and 3rd (at 2 kHz and 3 kHz). Beyond the 3rd harmonic the levels are very low. With both products, the 2nd harmonic dominates the THD measurement. The DAC1 produces a 2nd harmonic at about -106 dB. The DAC2 produces a 2nd harmonic at about -119 dB. It is important to note that the measured THD is dominated by the 2nd harmonic and not by high-order harmonics.
Note that the DAC1 has additional spurious tones that are not harmonically related to the 1 kHz test tone. These are caused by round-off errors in the 24-bit fixed-point processing used in the DAC1. The DAC2 shows no evidence of spurious tones except in the region near the AC line frequency.
The base of the green curve is below that of the red curve because the DAC2 produces less noise than the DAC1. Please note that the amplitude of individual tones can be read directly from an FFT, but the noise floor cannot. It takes a bit of calculation to derive a noise measurement from an FFT. In this side-by-side comparison we can see the difference in the noise of the two products, but, if these two products were measured with different FFT settings, the comparison would be invalid. For this reason, never use an FFT to compare the noise output of two devices unless all FFT settings are identical.
10 kHz FFT
If we increase the test tone to 10 kHz (and move our notch filter to 10 kHz) we can look at the high-frequency performance of the D/A converters.
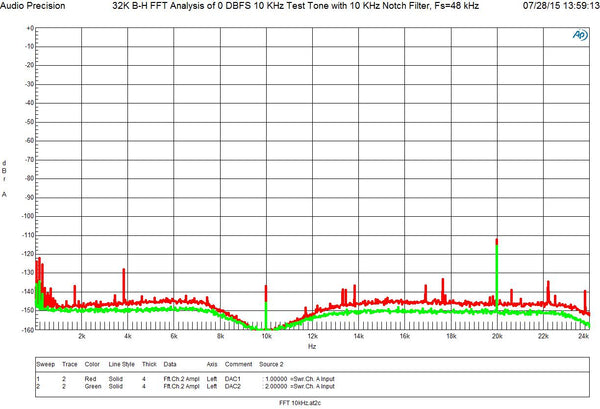
Figure 5: 10 kHz FFT
Figure 5 shows that the 2nd harmonic distortion remains very low when a high-level high-frequency tone is passed through the converters. The red trace shows that the DAC1 has a 2nd harmonic distortion product (at 20 kHz) that is 112 dB below the level of the test tone. The green trace shows that the DAC2 is about 3 dB better than the DAC1. This test indicates that both products have excellent slew rates, and excellent high-frequency performance.
IMD
The 19 kHz + 20 kHz 0 dBFS IMD (Intermodulation Distortion) test is useful for exposing slew rate problems. The twin tones are also a better model for music than a single tone. We will view the results on an FFT. To some extent, this test is limited by the IMD performance of the AP test station, but the AP2722 is capable of resolving the differences between the DAC1 and the DAC2.
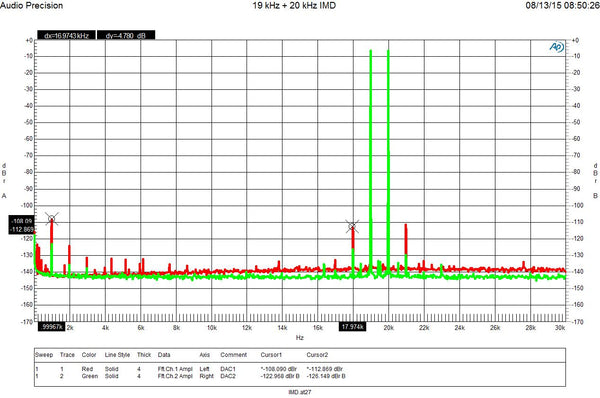
Figure 6: 19 kHz + 20 kHz IMD
Figure 6 shows that the DAC1 and DAC2 both have outstanding IMD performance. The 1 kHz, 18 kHz and 21 kHz distortion products are very low on both products. The red curve shows that the highest IMD product produced by the DAC1 measures 108 dB below the maximum output of the converter. The green curve shows that the DAC2 is at least 13 dB better than the DAC1. The measurement limits of the AP2722 may be limiting the measurement of the DAC2. All we know is that the DAC2 is at least as good as the measurement equipment.
The excellent IMD performance of both products highlights the excellent slew rate of the I-V (current to voltage) converters and the analog output stages.
Idle Channel FFT
If we remove the test tones we can use an FFT to look at the noise spectrum at the output of the D/A converters.
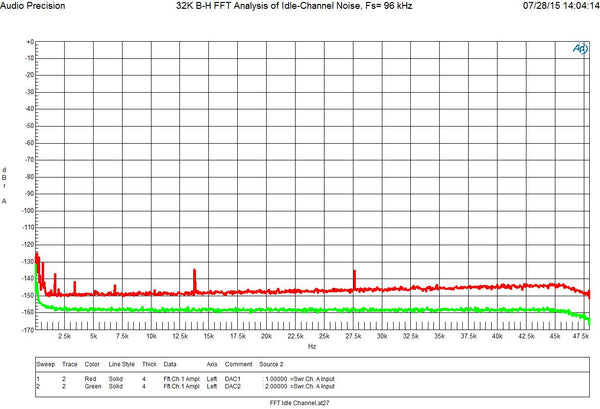
Figure 7: Idle Channel Noise Spectrum
Figure 7 shows that the DAC2 is 10 to 15 dB quieter at any given frequency in the audio band. The red trace shows that the DAC1 has several spurious tones. Ignoring AC hum, the worst spurious tone is an amazing 135 dB below the maximum output level. The green trace shows that the DAC2 is absolutely free from any spurious tones down to our measurement limit of about 160 dB below the maximum output. This is virtually perfect.
Notice that the noise produced by the DAC1 rises slightly with frequency while the noise produced by the DAC2 remains flat. The noise rise in the DAC1 is due to noise shaping in the digital processing. Again this difference is largely academic, but it does show how the technology has improved.
AC Line Noise
We can use an FFT to zoom in on the low-frequency region near the AC line frequency. The line frequency and its harmonics can create interference below 400 Hz. So, let's zoom in on the region between 20 Hz and 400 Hz:
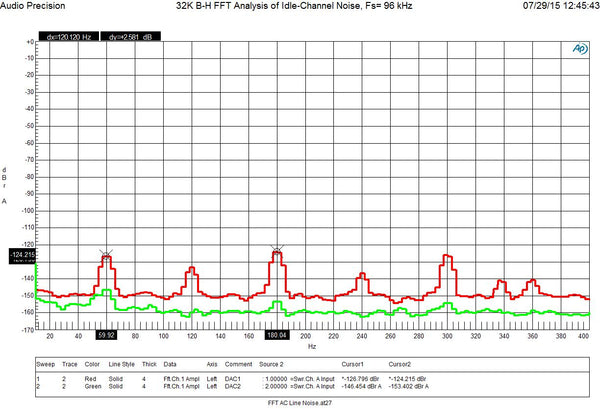
Figure 8: FFT of AC Line Noise - No Load
Figure 8 shows the AC line hum and noise in the output of the DAC1 and DAC2 when driven from a 60 Hz AC line. The red trace is the output of the DAC1 and the green trace is the output of the DAC2. Note that the DAC2 shows almost no evidence of AC interference while the DAC1 shows distinct line related spurs. The curious thing is that the DAC1 has a linear power supply while the DAC2 has a switching power supply. Most people incorrectly assume that linear supplies are quieter than switching supplies. This is a myth. Switching supplies can easily outperform linear power supplies in audio applications. For this reason, Benchmark has discontinued the use of linear power supplies in all new designs.
The red trace shows that the DAC1 has its highest peak at the 3rd harmonic of the line frequency (180 Hz). This is caused by the bridge rectifier in the DAC1's linear power supply. The second largest interference frequency in the DAC1 occurs at 60 Hz. This is caused by magnetic interference from the large 60 Hz toroidal transformer in the DAC1. We rotate the transformer in final test to minimize this 60 Hz interference. The large magnetic fields produced by line-frequency magnetic components can be very problematic. The DAC1 demonstrates that high-performance audio products can incorporate line-frequency magnetics in close proximity to analog circuits, but I can assure you that this was a difficult task when we created the layout for the DAC1.
The green trace shows that the switching supplies in the DAC2 are very quiet in the audio band. The DAC2 actually has 8 separate switching power supplies. 7 of the 8 are located on the circuit board. The 8th is the main AC to 12 volt power supply that feeds the 7 on-board DC to DC converters. This system is efficient, quiet, and compact, but it does cost more than the linear supply used in the DAC1.
AC Line Noise at Full Load
AC interference often increases when the power supply is heavily loaded. The HPA2™ headphone power amplifier in the DAC1 and DAC2 can be the largest consumer of power. In this next test we connected a 30-Ohm load to the HPA2™ and cranked it up.
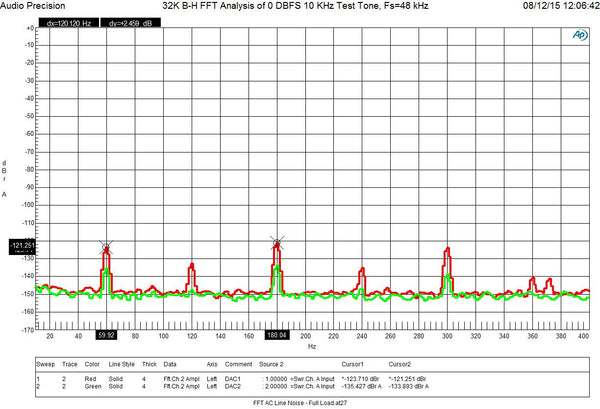
Figure 9: FFT AC Line Noise at Full Load
Figure 9 shows that there is a slight increase in AC line interference when the power supplies are fully loaded. The red trace shows that the AC interference at 180 Hz is 121 dB below the output level of the DAC1. The green trace shows that the 60 Hz line frequency interference is an amazing 135 dB below the output of the DAC2. It doesn't get any better than this. Both products are free from any audible hum, but the DAC2 demonstrates the superior capabilities of switching power supplies.
Benchmark's AHB2 power amplifier has an A-weighted SNR of 132 to 135 dB and it uses high-power switching power supplies which are in close proximity to the amplifier board. To match this performance with a linear supply, the AHB2 would have needed two separate chassis with about a foot of physical separation.
Frequency Response

Figure 10: Frequency Response
Figure 10 shows the frequency response of the DAC1 and DAC2. The red curve shows that the DAC1 response measures -0.23 dB at 20 kHz. This is excellent performance, but the green curve shows that the DAC2 measures -0.026 at 20 kHz. This difference is due to the higher oversampling ratio used in the DAC2. The higher ratio allows the use of higher cut-off frequencies in the analog filters that follow the oversampling D/A converter.
In most applications this frequency response difference is insignificant. However we did notice it in one listening test that we created using a DAC1 and ADC1. We created a 16th-generation dub by sending a recording through 16 cascaded A/D and D/A conversions. We then compared the 16th generation to the original to see if we could hear any differences. After careful listening we discovered that there was a slight attenuation in the high end. Each pass through the ADC1/DAC1 codec introduced an attenuation of about 0.24 at 20 kHz giving a total attenuation of 3.8 dB at 20 kHz (16 x 0.24 dB). This was audible but easily corrected with equalization. After equalization, we could not differentiate between the original and the 16th generation.
A careful examination of the two curves will also show that the DAC1 has slightly more ripple in the frequency response. However this ripple is insignificant from an audibility standpoint and it is hard to see even on this expanded scale. This difference is due to the improved digital filters in the DAC2.
Note that both products have excellent low-frequency extension. At the 10 Hz lower limit of the AP test station, the DAC1 measures - 0.01 dB and the DAC2 measures -0.006 dB. This excellent low-frequency extension is due to the fact that Benchmark products are designed with a 0.1 Hz cut-off frequency.
Left-Right Balance
The DAC1 and DAC2 converters are equipped with volume controls. This test measures the accuracy of the L/R balance as the volume control is rotated.
Figure 11: L/R Balance vs. Gain
Figure 11 shows what may be one of only 2 audible differences between the DAC1 and the DAC2. Both products have excellent balance at full volume, but the red curve shows that the DAC1 does have some imbalance at lower volume settings. In contrast, the DAC2 has virtually perfect L/R balance over the entire volume control range.
The DAC1 and DAC2 use entirely different methods of volume control. The DAC1 has an active analog volume control and the DAC2 has a 32-bit digital volume control that directly feeds the 32-bit converter in the DAC2. No analog volume control can match the precision of a digital control. But digital volume controls place a higher demand on the SNR performance of the D/A converter. The DAC2 has a SNR that is 10 dB better than that of the DAC1. Given this improvement, the digital volume control is the best choice. The digital control in the DAC2 eliminates the small but possibly noticeable L/R imbalance of the analog control in the DAC1.
Intersample Overs
The concept of inter-sample "overs" can be a bit hard to grasp. If you are not familiar with the topic see "Audio That Goes to 11" and "Why Audio Goes to 11". These two application notes introduce the topic. PCM digital signals can contain peaks between samples that can exceed the normal limits of the digital system by about 3 dB.
Intersample overs are common in 44.1 kHz and 48 kHz recordings as these sample rates can have substantial audio energy at 1/4 of the sample rate. Intersample overs are much less of a problem with 2X and 4X sample rates because there is very little audio energy at 1/4 of these higher sample rates.
Substantial intersample over problems can be created by MP3 compression. MP3 files must be decoded and converted back to PCM (a necessary part of the playback process), and when this happens, many intersample overs are created. The same holds true for other lossy compression systems.
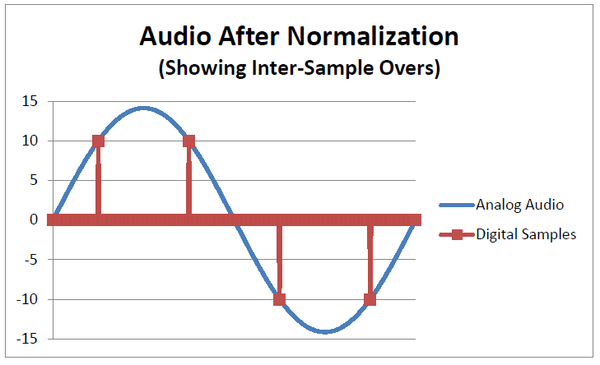
Figure 12: Intersample Overs
Figure 12 is a graphic that shows how a sine wave can exceed the levels captured by the digital samples. The graphic shows four samples of a sine wave that has a frequency that is exactly 1/4 of the sample rate. If "10" and "-10" are the digital clip points, it is clear that the peaks are much higher than the digital clip points. This sine wave is 3.01 dB above 0 dBFS. This is the worst-case intersample over that will typically be encountered with a properly band-limited signal. This is the +3.01 dB test signal that we used in the next test.
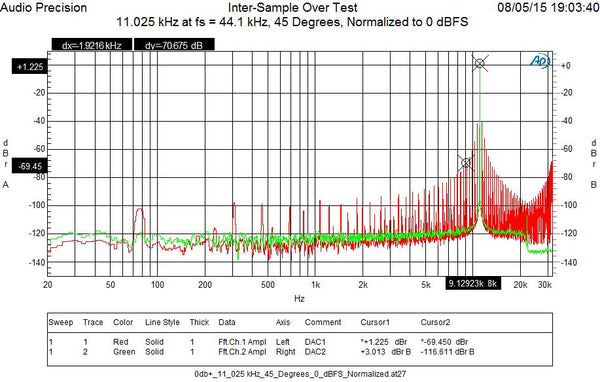
Figure 13: FFT of Intersample Over
Figure 13 shows the spectral output of the DAC1 and DAC2 converters when fed with a +3.01 dB intersample over at exactly 1/4 of the sample rate. The red curve shows that the DSP in the DAC1 overloads and creates a splatter of energy across the entire audio band, with most of the energy concentrated in the higher frequencies. In contrast, the green curve shows that the DAC2 has the digital and analog headroom to pass the 3.01 dB over without distorting. Cursor 1 on the green curve shows that the DAC2 reproduced the tone at the correct +3.01 dB level without distorting.
The distortion caused by the DSP clipping of intersample overs can create transient bursts of high-frequency distortion that add an artificial brightness or harshness to the music. The DAC2 is one of very few converters that are designed to eliminate this problem. This creates an audible difference between DAC2 and most other converters (including the DAC1).
Summary
The side-by-side test shown in this paper demonstrate the improved transparency of the DAC2. All distortion products are well below audibility, and the L/R balance is spot on. The added headroom in the DAC2 eliminates the audible effects of intersample clipping. The 32-bit digital volume control provides distortion-free volume control with precise L/R balance (also providing an audible improvement over the DAC1). See "Benchmark DAC2 vs. DAC1 - Is There an Audible Difference?" for an in-depth discussion of the audible differences between the DAC1 and the DAC2.
A Final Word About Transparency
Benchmark products are designed for maximum transparency and are not designed to euphonically enhance the sound. In a studio monitoring environment, transparency is extremely important. In a home environment, the listener can choose a transparent system, or a system that is designed to alter the sound. It comes down to preference. Neither choice is wrong.


