Buy one component and save 10% on up to 2 cables. Buy 2 components and get 4 free cables. Free shipping on USA orders over $700.
Buy one component and save 10% on up to 2 cables. Buy 2 components and get 4 free cables. Free shipping on USA orders over $700.
AHB2 - Lab Report - Oh Hyeonil - Studio51, Sinlyul Lee Ph.D. - Sonicast
by Benchmark Media Systems September 01, 2018
Author: Oh Hyeonil, Studio51
Test data provided by: Studio51, Sonicast, Sinlyul Lee, Ph.D.
The original report can be downloaded here in PDF format:
The following is a translation of the original report:
Introduction
The measured performance of an audio amplifier can be quantified with common measurements such as THD+N, dynamic range, frequency response, and output power. Numerical superiority is often recognized as a sign of a good device and this tends to lead to higher prices. In the case of power amplifiers, the price is often determined solely by the amp's power output, THD, and brand.
However, if two power amplifiers have identical specifications, there may still be audible differences when listening to music. This has been expressed in vague terms such as 'driving power' and 'reaction force' which are almost the same as the realm of superstition. In fact, speakers used in conjunction with power amplifiers have all the elements of resistance, capacitance, and inductance that are fundamental to electrical circuits. Speaker manufacturers usually talk only about impedances in terms of ohms, but the capacitive and inductive components of speaker impedance create a phase angle between current and voltage. It may sound a bit complicated, but this means that an 8 ohm speaker will behave differently than an 8 ohm dummy resistor when driven by a power amplifier.
A speaker is always a more difficult load than a resistor of the same impedance.
To accurately measure the performance of a power amplifier, it must be measured at various impedances and with varying phase angles between current and voltage.
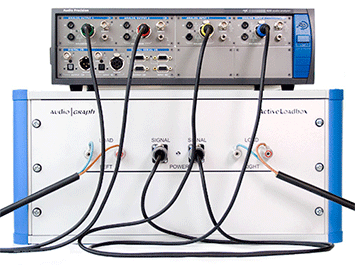
To do this we need a speaker simulation device such an AudioGraph Active Loadbox which can precisely simulate the speaker R, L, and C components of a speaker load. Unfortunately, few manufacturers have provided such measurements until now. This may have been because some manufacturers did not want to advertise the shortcomings of their amplifiers, or it may be that they lacked the proper measuring equipment.
Over the years, audio measurement equipment has improved and new devices have been introduced. When the Audio Precision and Audio Graph products are combined, it is easy to measure the amplifier's performance at various angles, and these test results should be more readily available in the near future.
Audio Precision APx555 with an AudioGraph Active LoadBox
Electrical vs. Acoustic Measurements
Measurement of electrical performance is easier and clearer in some respects than measurement and evaluation of acoustical performance. Unlike complex acoustical measurements, which often require the use of an anechoic chamber and a microphone array to measure three-dimensional acoustic properties, electrical measurements are a one-dimensional phenomenon in which the path of a signal travels along a signal line. Since it is only necessary to compare the characteristics of an output signal to an input signal, the evaluation of the result is relatively easy.
The measurement equipment evaluates the DUT (Device Under Test) by comparing the input waveform to the output waveform. Measuring methods include closed loop measurement, in which digital or analog signals are input to the DUT, such as DACs, power amplifiers, and headphone amplifiers, and the DUT output is connected to the measurement equipment to form a complete loop. Another method is an open-loop measurement in which the DUT input is not connected to the measuring equipment, such as a smartphone, or MP3 player. In this series of measurements we are using closed loop tests because amplifiers have inputs and outputs that can be connected directly to the test equipment.
Benchmark Media's AHB2 is a power amplifier with very low THD and very low noise. Some of the performance is beyond the measurement limits of our AudioPrecision APx525. With the help of B & P International, AudioPrecision's Korea branch, we were able to obtain AudioPrecision's top-of-the-line model, the APx555, to complete our tests of the AHB2 power amplifier. The APx555 it the highest performance audio measurement instrument available today. We would like to take this opportunity to express our gratitude to B & P International for providing the latest high-end APx555 equipment.
The Active LoadBox is a device made by AudioGraph, Sweden. It has 1Ω, 2Ω, 4Ω, 8Ω pure resistive loads. It also has both inductive and capacitive loads with voltage to current phase angles of 0, ± 30, ± 60 degrees. This gives a total of 20 different loads that can be applied to simulate speaker loading.
AudioPrecision APx 555
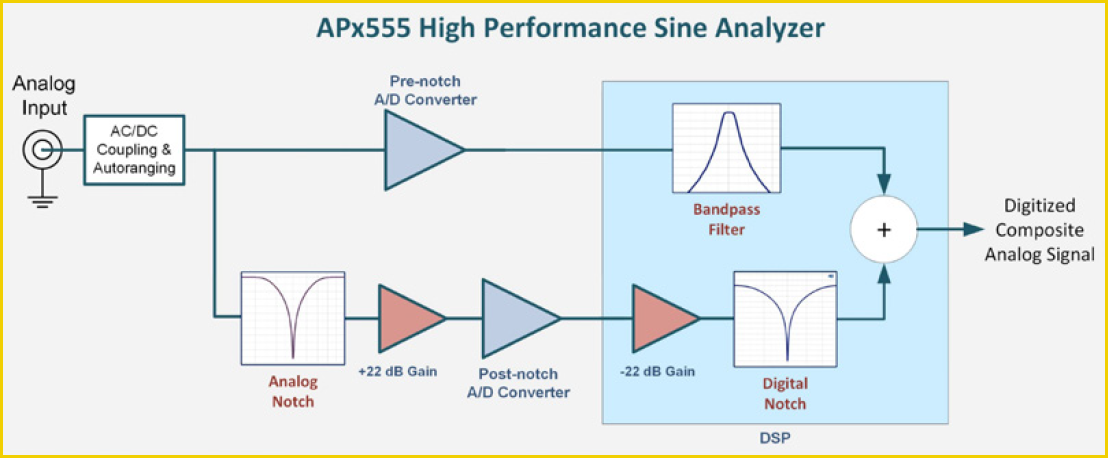
APx555 High-Performance Sine Analyzer - Block Diagram
The APx555 uses dual-domain measurement techniques, both analog and digital, to increase measurement accuracy and minimize noise levels. When the APx555's High Performance Sine Generator is selected, an analog RC oscillator is enabled instead of the traditional DAC, resulting in higher purity sine waves. When the High Performance Sine Analyzer is enabled, an analog notch removes the fundamental tone and the residual signal is input to an ADC after analog amplification. It is then attenuated by the same amount in the digital domain. A digital notch filter is then applied to supplement the analog notch filter to improve the resolution of the measurements.
The APx555 input and output terminals support both balanced and unbalanced analog inputs and outputs, 192K digital I/O including AES/EBU, TOSLINK and SPDIF. In addition, I/O can be extended via HDMI, PDM, and Bluetooth options including Digital Serial, ARC, and a new Advanced Master Clock (AMC) module that allows input and output of clock signals to synchronize external devices with the APx555.
The APx555 also has special features for measuring power amplifiers. These include measurement of continuous maximum output, peak output, DIM measurement, power spectral view, and a regulated frequency sweep. It supports measurements to CEA-2006 and CEA-490A standards as well as CMRR measurements in accordance with IEC60268 14.15.1.
Measurement Overview
Unlike acoustic audio measurements, electrical audio performance measurements do not require a microphone. Just as with conventional DAC and amplifier connections, you can connect them using a shielded cable to a measurement device. In addition, the input and output conditions must be matched well. In case of the digital input device, the digital output level of the measuring device and the sampling rate must be matched. In the case of analogue input devices, it is necessary to define the maximum input level through the input level specified by the manufacturer.
Bandwidth and weighting filters should be defined when measuring acoustic signals. In this measurement, an Elliptic filter having a bandwidth of 20 Hz to 20 kHz, which is a human audible limit, was used based on AES and IEC standards. For the noise and SNR measurement, an A-weighting filter approximating the human auditory curve was used and a CCIR-2K filter was used for digital signals. The AHB2, the power amplifier to be measured, accepts a balanced input, and since the manufacturer defines +22dBu as the recommended input level to reach full output power, most input signals, except the residual noise measurement, are set to +22dBu.
Since the AHB2 is a power amplifier that is intended to drive speaker loads, the actual performance can only be measured when it is connected to the intended load. However, if you connect a speaker, you will not be able to measure the correct power amplifier performance because the measurement result will reflect the distortion of the speaker, as explained at the beginning. To solve this problem, we used the Active Loadbox to simulate actual speaker loads. The Active Loadbox is a device made by AudioGraph, Sweden. It has 1Ω, 2Ω, 4Ω, 8Ω pure resistance loads, and It has both inductive and capacitive loads to provide current to voltage phase angles of 0, ± 30, ± 60 degrees. This provides a total of 20 different loads that can be applied to the amplifier to simulate virtually any speaker load.
The AHB2 is basically a stereo power amplifier, but it also includes a Bridge-Mono mode, which provides twice the output voltage of the individual channels. We include all of the bridge mode measurements in this report. The "Test Conditions" describe the input and output conditions of the measuring equipment with each test.
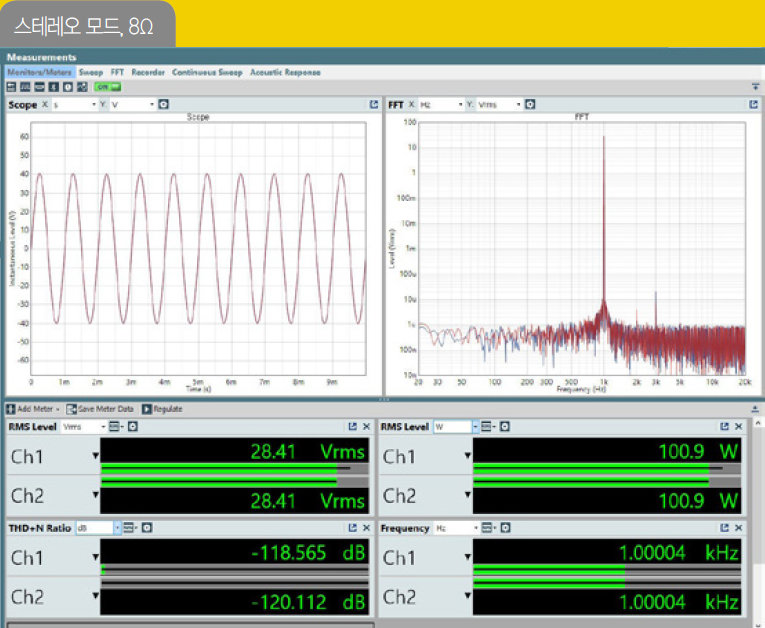
Output Power - 8 Ohm Stereo
Test Conditions:
- + 22dBu input, 1,000Hz, HPF: 20Hz, LPF: 20kHz, 8-Ohm Stereo Load
Measurements:
- 28.41 Vrms into 8 Ohms @ -118.6 dB THD+N
- 100.9 W into 8 Ohms @ 0.00012 % THD+N
Output Power 2-Ohms Stereo
Test Conditions:
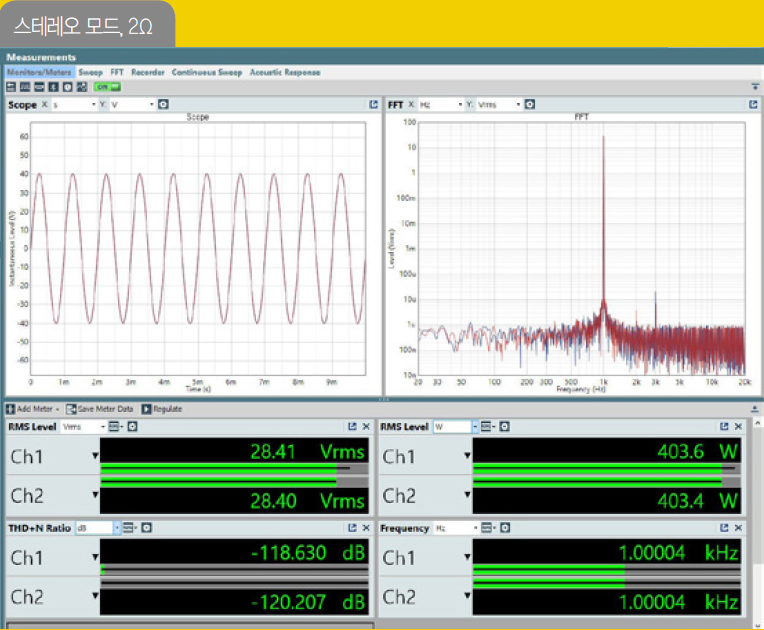
- + 22dBu input, 1,000Hz, HPF: 20Hz, LPF: 20kHz, 2-Ohm Stereo Load
Measurements:
- 28.41 Vrms into 2 Ohms @ -118.6 dB THD+N
- 403.6 W into 2 Ohms @ 0.00012 % THD+N
Power Cube Plot - Stereo Mode
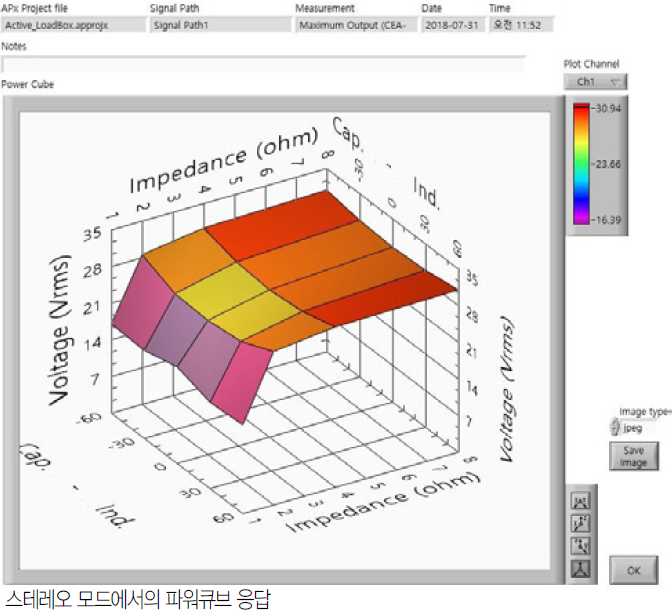
The output voltage drop from 8Ω to 4Ω is hardly noticeable, and the voltage drop is very small even with a 2Ω load connection.
The power cube response, shows remarkable performance in stereo mode. Even with a 1Ω load, the amplifier delivers nearly the same output voltage under each of the five phase angle conditions (0, ± 30, and ± 60 degrees).
Residual Noise and SNR
Test Conditions:
- HPF: 20 Hz, LPF: 20 kHz, A-wtd
Measurements:
- 7.645 uVrms (132.278 dB SNR) - Ch1, Stereo Mode
- 7.300 uVrms (132.145 dB SNR) - Ch2, Stereo Mode
- 10.5 uVrms (134.8 dB SNR) - Mono Mode
Dynamic Range
Test Conditions:
- 1,000 Hz, -60 dB, HPF: 20 Hz, LPF: 20 kHz, CCIR-2K wtd
DNR (Dynamic Range) is measured using a -60 dBFS signal. Basically, it has the same value as SNR, but the weighting filter is different, so DNR is generally about 3 to 4 dB less than the SNR measurement.
Measurements:
- 128.378 dB - Ch1, Stereo Mode
- 128.506 dB - Ch2, Stereo Mode
THD+N
Test Conditions:
- + 22dBu input, 1,000Hz, HPF: 20Hz, LPF: 20kHz, 8-Ohm Stereo Load
Measurements:
- -118.259 dB (0.000122 %) - Ch1, Stereo Mode
- -120.161 dB (0.000098 %) - Ch2, Stereo Mode
- Better than -118 dB (0.000125 %) into 8 Ohms, Mono Mode
FFT
Test Conditions:
- + 22dBu input, 1,000Hz, HPF: 20Hz, LPF: 20kHz, 8-Ohm Stereo Load
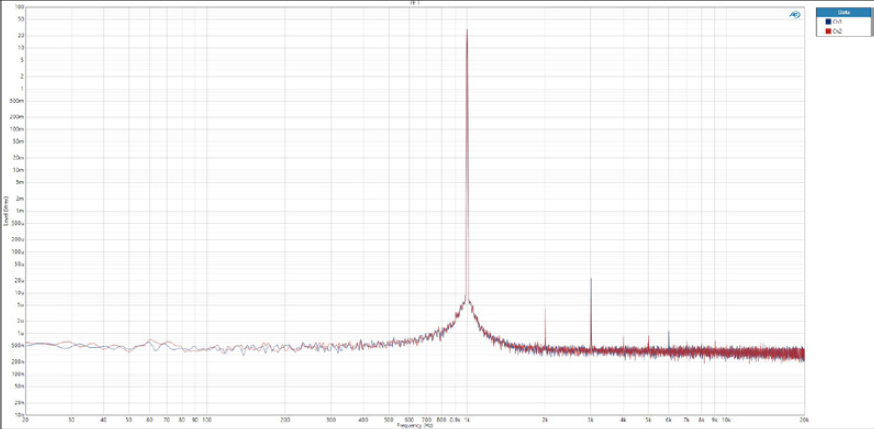
The second and third distortions are seen in the graph, but it is necessary to pay attention to the magnitude value. The magnitude value is 20 μVrms (-123 dB relative to output level or 0.000071 %THD), which is not much different from the residual level of the measuring instrument.
IMD
Test Conditions:
- SMPTE, 41 Hz, 7,993 Hz, 4:1 ratio
- CCIF 18 kHz, 20 kHz 1:1 ratio
- +22dBu input, HPF: 20Hz, LPF: 20kHz
Measurements:
- -110 dB, Stereo Mode
- -113.3 dB, Mono Mode
IMD, which is measured by inputting two sine waves at the same time, is very good at -110 dB in stereo mode and -113.3 dB in bridged mode. The high performance sine analyzer of the APx555 instrument does not support the IMD measurements so the analyzer residual distortion is higher when running IMD tests. This is limitation of the analyzer is reflected in the IMD results.
Frequency Response
Test Conditions:
- 1Hz ~ 96kHz, + 22dBu input
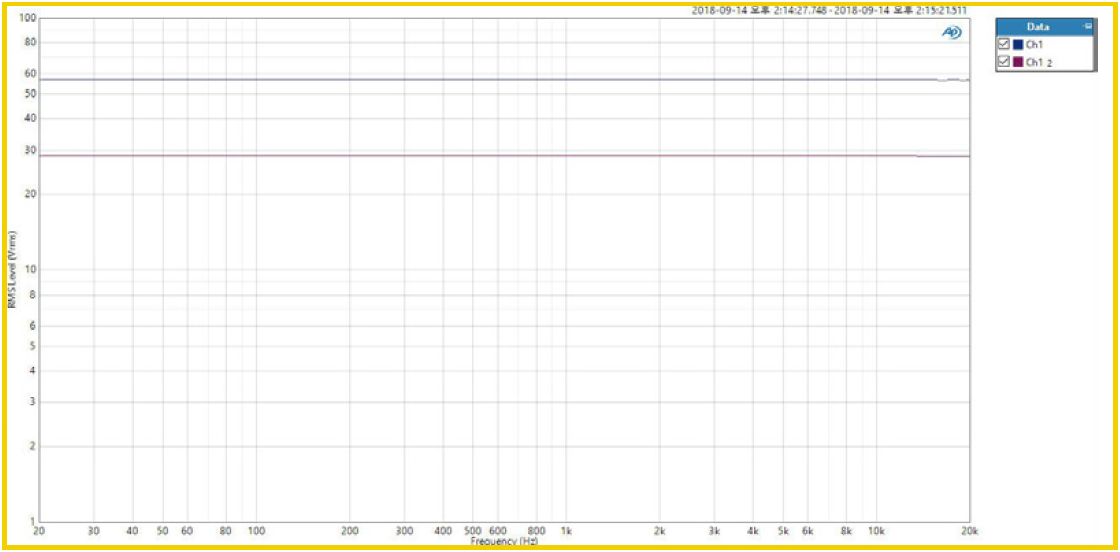
The frequency response is perfectly flat up to 20 kHz, even though it is measured at maximum output. This means that the input signal is amplified as it is.
Crosstalk
Test Conditions:
- 10 kHz, + 22 dBu input, HPF: 20 Hz, LPF: 20 kHz

The crosstalk represents the degree of interference between the left and right channels. The lower the crosstalk value, the more clearly separated left and right stereo images are transmitted, and there is less electromagnetic interference between the signals flowing inside. The higher the frequency, the worse the crosstalk caused by the electromagnetic waves. The AHB2 has a crosstalk of -110dB, which is almost unaffected by other channels.
Output Impedance / Damping Factor
Test Conditions:
- 20 to 20 kHz, 20 dBu input, HPF: 20 Hz, LPF: 100 kHz
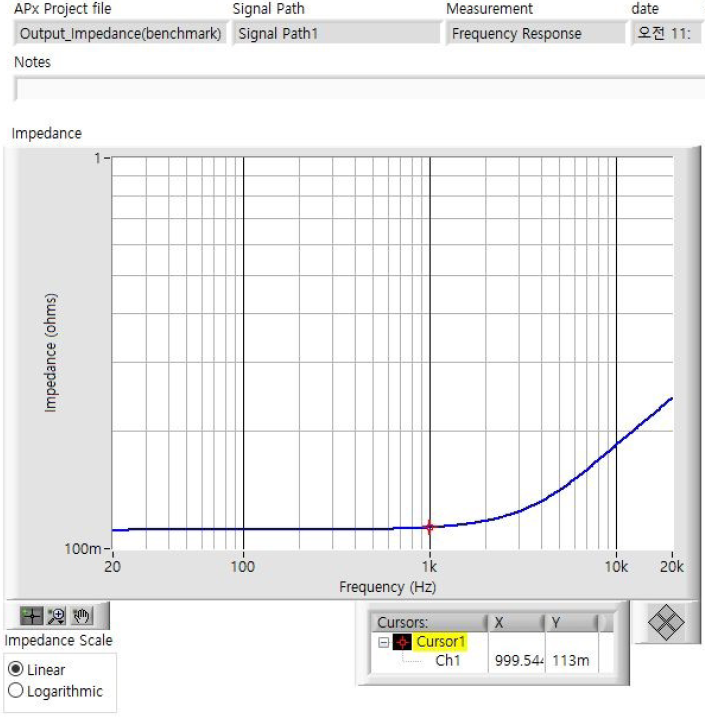
The output impedance measures the impedance of the amplifier output stage. The lower the output impedance, the higher the damping factor value. A speaker with a large fluctuation of the impedance graph responds sensitively to the output impedance value, and the lower the output impedance, the better the damping (especially near the resonance frequency) becomes. The output impedance is 0.1Ω at 1 kHz, which is significantly higher than the 0.02Ω specified by the manufacturer. This is because the measured resistance of the cable is reflected in the measured value, not the actual output impedance of the amplifier. The cable resistance used in the test was measured by a tester, and a value close to 0.1Ω was measured, confirming that 0.02Ω was the amplifier output impedance value.
Conclusion
The Benchmark Media AHB2 showed the highest level of audio performance in all metrics. Despite being a half-rack-sized compact product, it provided a constant voltage across a wide range of loads. In bridged mode it delivered 1,600 W peak into 2Ω. In stereo mode, it performed well into a 1Ω impedance load at phase angles of 0, ± 30, and even ± 60 degrees which is a very harsh operating environment. The amplifier is ideally suited low-impedance and phase-shifted loudspeakers, which are commonly referred to as "hard-to-drive speakers."
In SNR and THD measurements are very impressive, exceeding some of the measurement limits of the best measurement equipment available. The stereo-mode output of 100 W into 8Ω and 400 W into 2Ω is more than sufficient output under most conditions. If you need more power, you can use Bridge mono mode.
Also in Reviews

CAF 2025 Best of Show - Krix Home Theater - Powered by Benchmark
by Benchmark Media Systems November 24, 2025

"The setup used ... ten Benchmark AHB2 amps, and a Storm Audio ISP Elite 24 MK3 surround processor."
"The system delivered serious punch and clarity."
"During the car chase and gunfight sequence from No Time to Die, the Krix setup managed to convey the intensity and scale of a far larger theater—tight, immersive, and controlled. Proof that with the right engineering and setup, even a small room can deliver big-cinema energy."
- Brian Mitchell, ecoustics.com

AHB2 - Stereophile 2025 Recommended Component - Power Amplifiers
by Benchmark Media Systems November 23, 2025

AHB2 - Receives Stereophile's Top Rating for Power Amplifiers
"An extraordinary amplifier."
- John Atkinson
"Much more apparent low-level detail in already-familiar recordings"
- Kalman Rubinson

KRIX 11.6.6 Home Theater - Powered by 10 Benchmark AHB2 Amplifiers - CAF 2025
by Benchmark Media Systems November 22, 2025
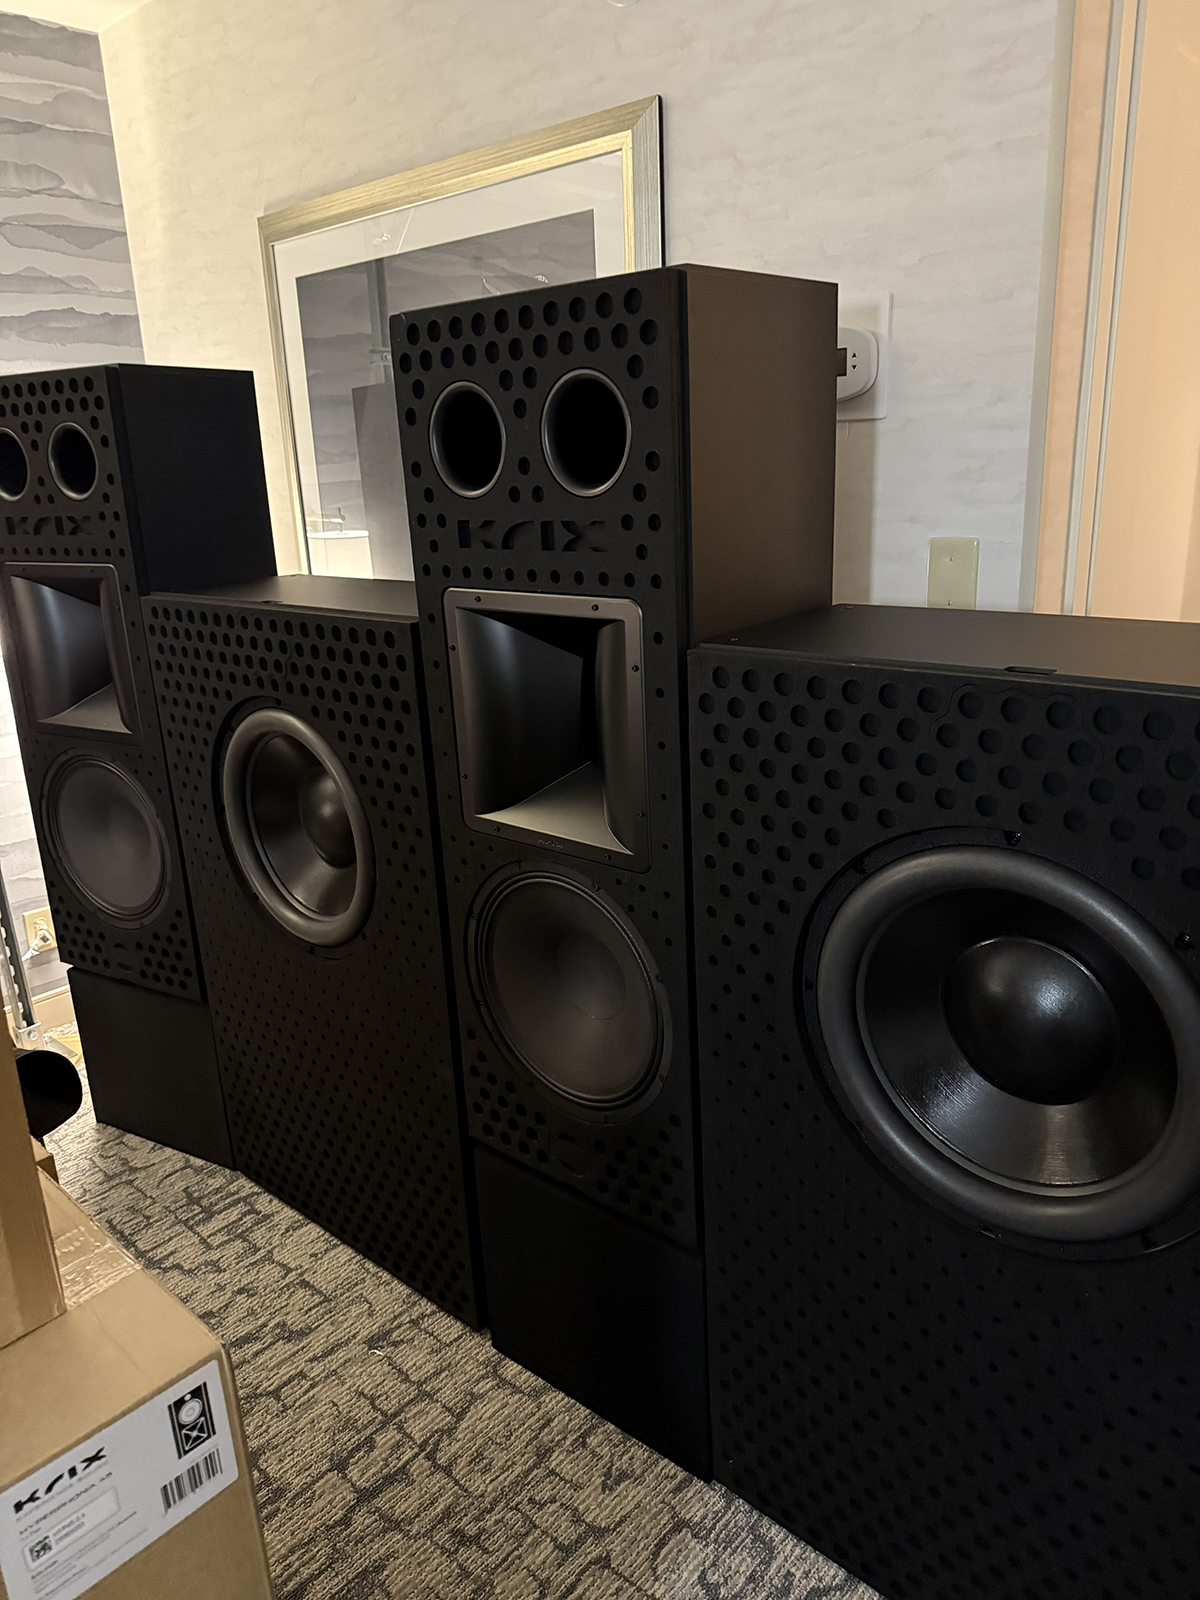 "The final visual and audio results in this room were indeed spectacular."
"Complete and total immersion, with clean, clear sonics that were not fatiguing at all."
- Carlo Lo Raso, SECRETS of Home Theater and High Fidelity


