If you are using a separate preamplifier with your Benchmark DAC, then this video is for you!
All Benchmark DACs Can Be Used Without a Preamplifier
Most Benchmark DACs include preamplifier functions such as a volume control and audio input selection. These DACs are designed to directly drive virtually any audio power amplifier without the need for a separate preamplifier. This is important, since most preamplifiers will rob some of the transparency that we have built into the Benchmark DACs. But, when it comes to system transparency, the Benchmark LA4 and HPA4 preamplifiers can actually improve the system performance by a few dB while adding other convenient features. Some of our customers choose to insert a non-transparent tube preamplifier between their Benchmark DAC and their power amplifier in order to modify the sound of their system.
All Benchmark DACs Can Be Configured for use with External Preamplifiers
All Benchmark DACs include special functions to make it easy to integrate a separate preamplifier. The DAC volume control, DIM function, and MUTE function can be bypassed collectively or individually, according to the needs of your system.
Add a Preamplifier to Increase System transparency
Benchmark makes two preamplifiers; the LA4 and the HPA4. These feature pure analog relay-controlled volume and relay-controlled input switching. These preamplifiers can actually improve the end-to-end signal to noise ratio of your system while also allowing your DAC to operate at its optimum output level. These two Benchmark preamplifiers can be added to increase the transparency of your system.
Add a Preamplifier to Modify the Sound of Your System (Decreased Transparency)
Other preamplifiers, especially those containing tubes, can be added to create a particular sound that is decidedly not transparent. This choice is a matter of personal preference.
Watch this Video to Learn How to Configure Benchmark DACs for Compatibility with an External Preamplifier
Products Discussed in this Video
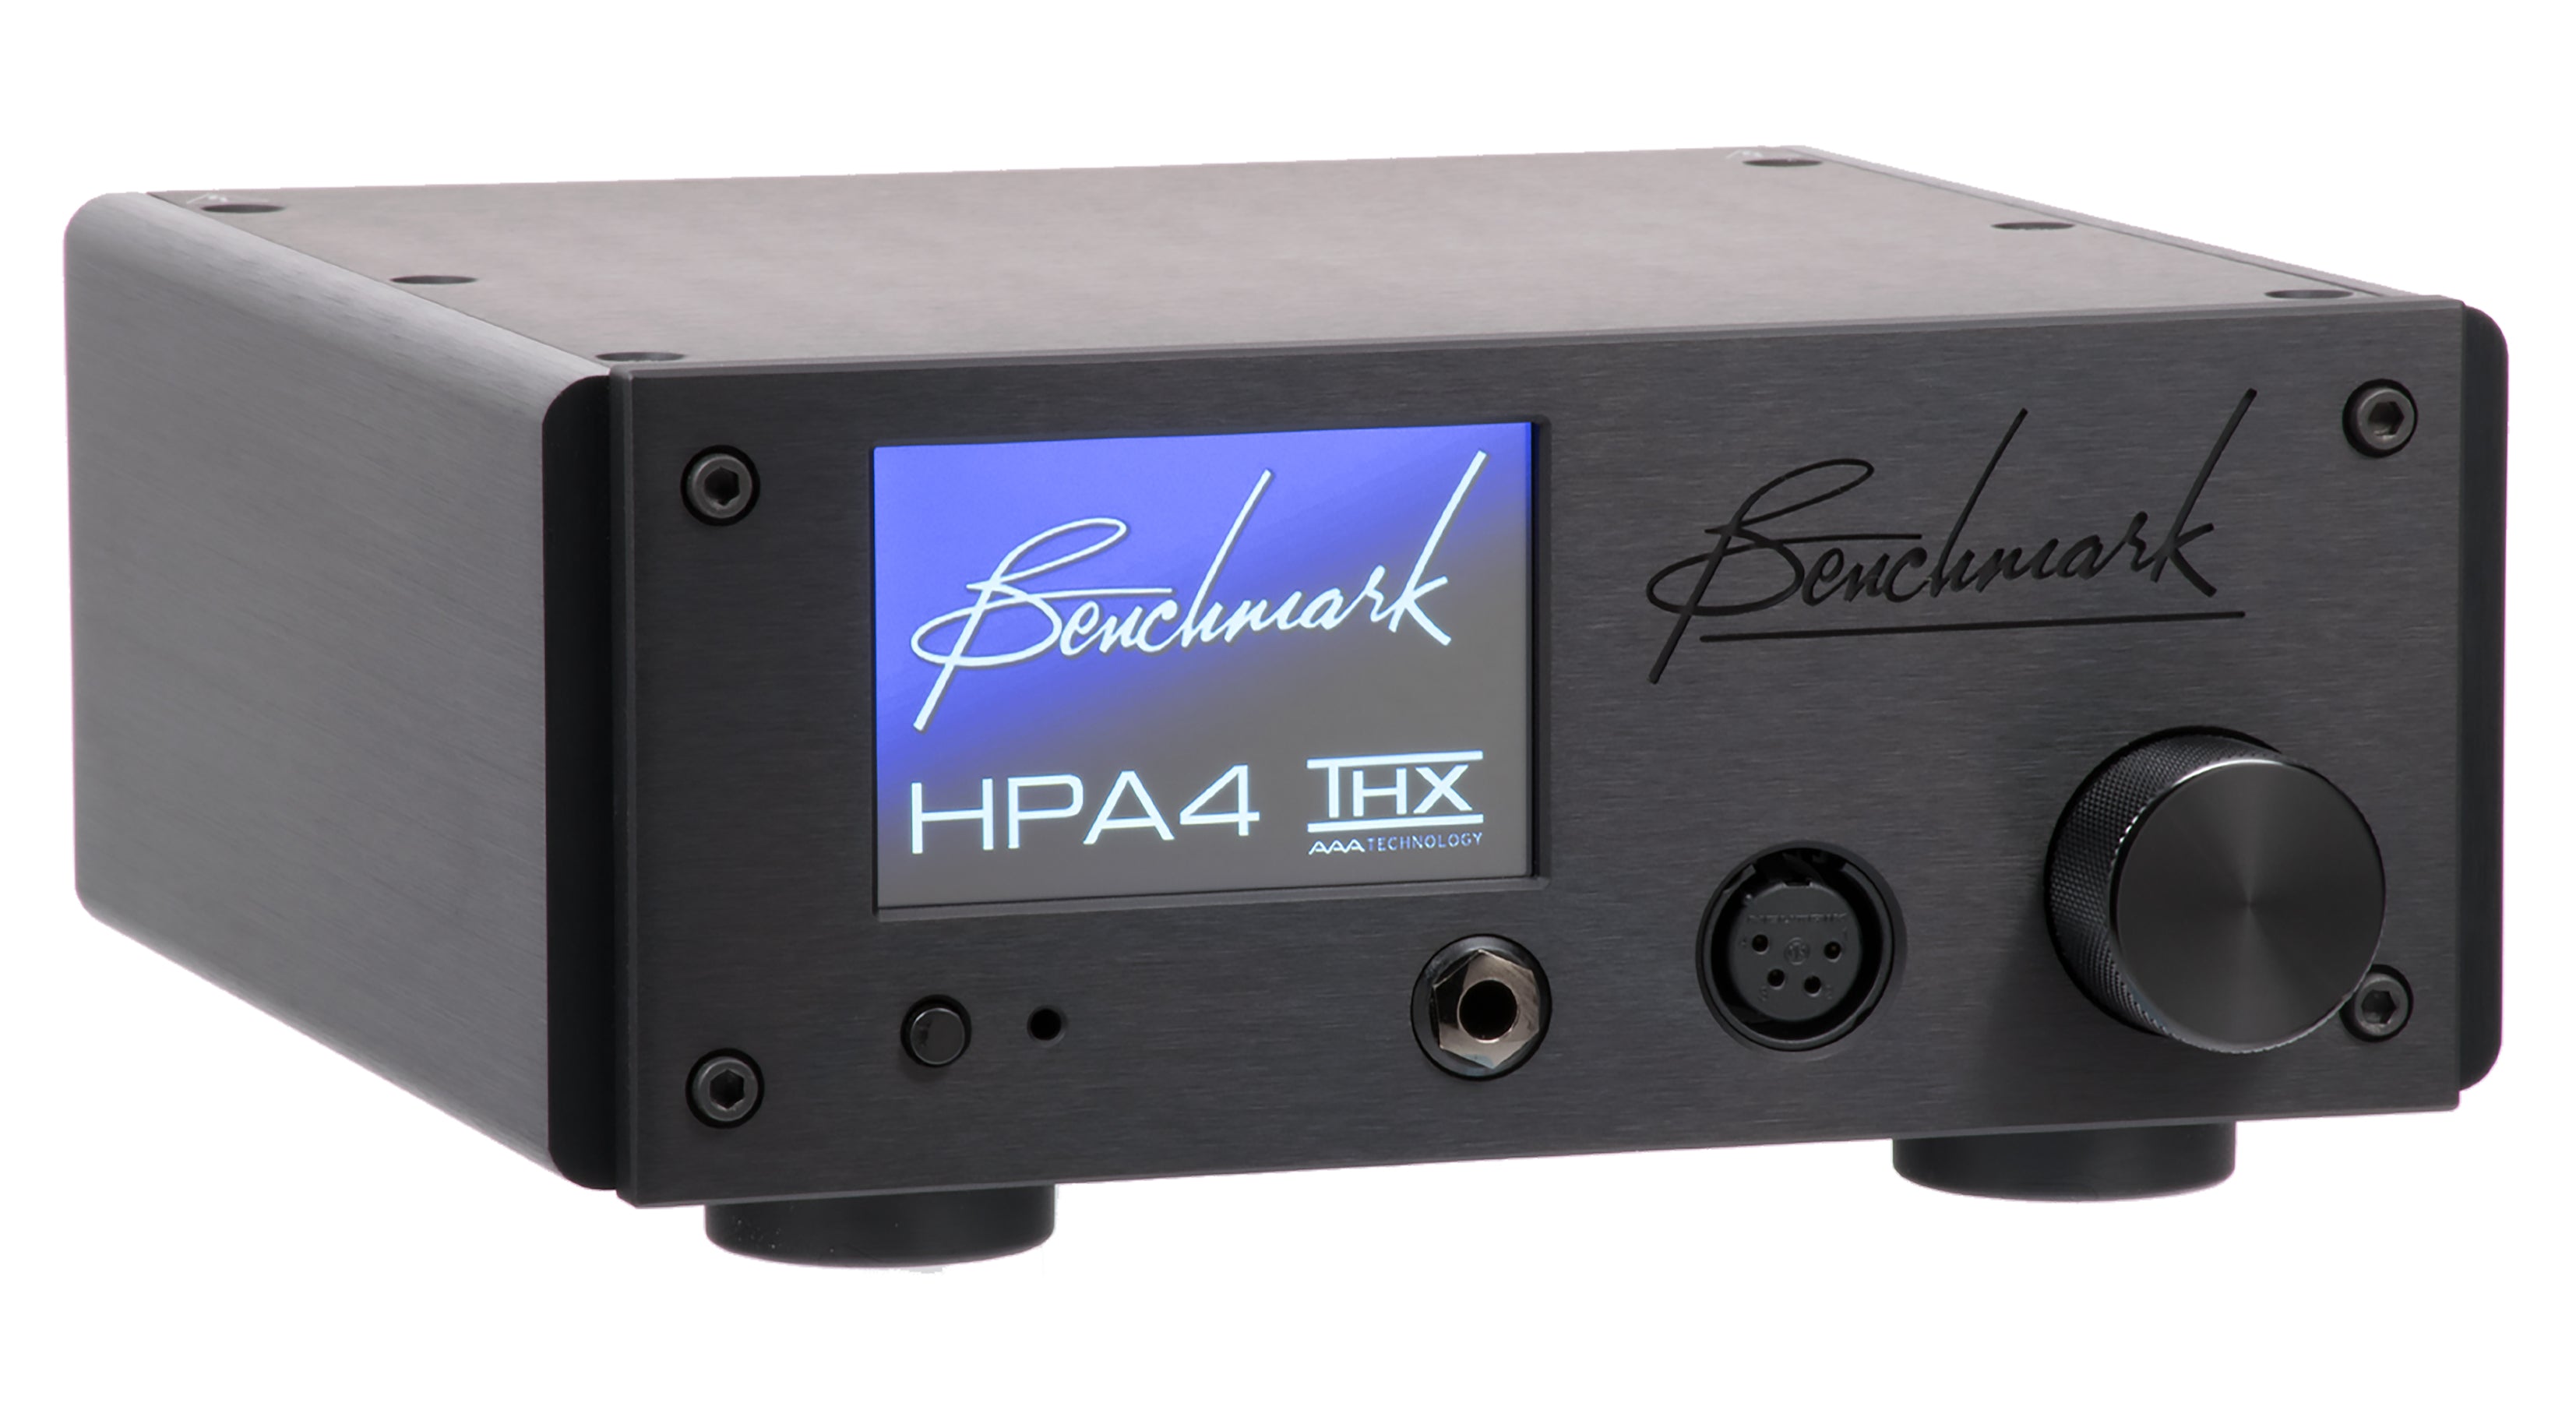
The Benchmark HPA4 Headphone Amplifier
- THX-888 Headphone Amplifier featuring Feed-Forward Error Correction
- Entire Signal Path is Relay Controlled
- 256-Step Relay-Controlled Volume
- Lowest Noise, Lowest Distortion Preamplifier Available
- International Power Supply
- High Power Headphone Output
- Independent Line-Level Output
- Certified for Pro or Hi-Fi Applications
- Supports full Studio-Level Balanced Inputs and Outputs
- 0.1 Hz to 500 kHz Bandwidth

The Benchmark LA4
- Identical to the HPA4, but without the Headphone Amplifier
 The Benchmark DAC3 Converter Family
- +3 dBFS DSP and DAC Headroom - No Clipping of Intersample Peaks
- Linear Phase Reconstruction Filter - Preserves Analog Waveshape
- Switch-Mode Power Supplies - No Magnetic Interference
- UltraLock3(TM) Jitter Attenuation
- Professional Studio Level Balanced Outputs - Factory Default
- HiFi Level Balanced Outputs - User Selected
- Available in 3 Models - Options Include Headphone Amp and Volume Control
- All Models Deliver Identical Performance


